Transcription of CENTRIFUGAL PUMP SELECTION, SIZING, AND …
1 CENTRIFUGAL PUMP SELECTION, SIZING, AND INTERPRETATION OF PERFORMANCE curves PUMP CLASSES pumps may be classified in two general types, dynamic and positive displacement. Positive displacement pumps are those in which energy is imparted to the liquid in a fixed displacement volume, such as a casing or a cylinder, by the rotary motion of gears, screws, or vanes, or by reciprocating pistons or plungers. CENTRIFUGAL pumps are dynamic pumps . Energy is imparted to the liquid by means of a disk with curved vanes rotating on a shaft called the impeller. The impeller imparts kinetic energy to the fluid by means of its shape and high rotational velocity.
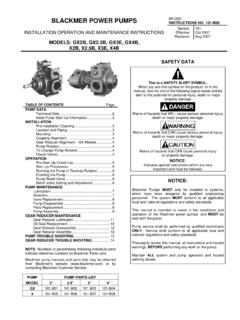
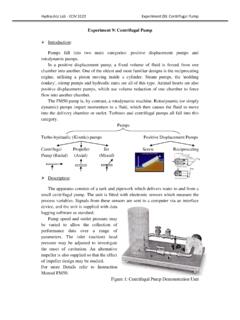
2 This energy is transformed to pressure energy when the fluid reaches the pump casing (see Figure 1-12). The pressure head difference between the inlet and the outlet, or Total Head produced by the pump, is proportional to the impeller speed and diameter. Therefore, to obtain a higher head, the rotational speed or the impeller diameter can be increased. To learn more about how a CENTRIFUGAL pump increases a fluid's pressure, see reference 15. How a pump produces pressure is beyond the scope of this book, but an interesting experiment you can try at home will illustrate a similar process. A small plastic bottle is required to which a string is attached.
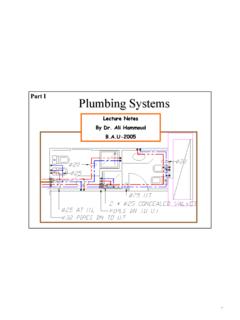
3 Twist a rubber band around the bottle s neck a few times and attach two 3-foot long strings, one on each side of the glass. Tie the other ends of the string together, fill the glass half full with water and hold it suspended from the strings. Start spinning. As you may have guessed, the fluid inside the glass will become pressurized. How do you know that the fluid is pressurized? To prove it to yourself, make a very small hole in the glass bottom. Make the hole just large enough for water to dribble through. Now spin the glass again. The water will spray out of the glass bottom no matter what its position, up or down.
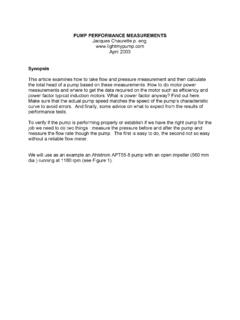
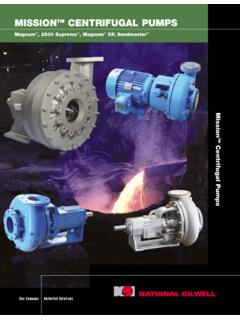
4 Figure 4-1 Using a spinning bottle to demonstrate CENTRIFUGAL force. 4 2 PUMP SELECTION, SIZING AND INTERPRETATION OF PERFORMANCE curves COVERAGE CHART FOR CENTRIFUGAL pumps A coverage chart (see Figure 4-2) makes it possible to do a preliminary pump selection by looking at a wide range of pump casing sizes for a specific impeller speed. This chart helps narrow down the choice of pumps that will satisfy the system requirements. PERFORMANCE CURVE CHART The following figure shows a typical pump performance chart for a given model, casing size, and impeller rotational speed.
5 A great deal of information is crammed into one chart and this can be confusing at first. The performance chart covers a range of impeller sizes, which are shown in even increments of 1/2" from 7 1/2" to 9 1/2". Impellers are manufactured to the largest size for a given pump casing and machined or "trimmed" to the required diameter when the pump is sold. Figure 4-2 Typical pump capacity coverage chart. Figure 4-3 Typical pump performance curve. PUMP SELECTION, SIZING AND INTERPRETATION OF PERFORMANCE curves 4 3 Performance Curve At some point in the pump selection process, the impeller diameter is selected.
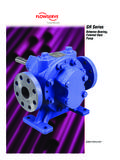
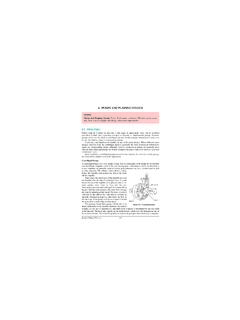
6 For an existing pump, the diameter of the impeller is known. For a new pump, our calculations of Total Head for a given flow rate will have determined the impeller diameter to select according to the performance curve. Figure 4-4 shows only the information relevant to the 8 1/2" impeller performance curve. A performance curve is a plot of Total Head vs. flow rate for a specific impeller diameter and speed. The plot starts at zero flow. The head at this point corresponds to the shut-off head of the pump, point A in Figure 4-4 (more about this later). Starting at this point, the head decreases until it reaches its minimum at point B.
7 This point is sometimes called the run-out point and represents the maximum flow of the pump. Beyond this, the pump cannot operate. The pump's range of operation is from point A to B. Efficiency curves The pump's efficiency varies throughout its operating range. This information is essential for calculating the motor power (see section ). The (best efficiency point) is the point of highest efficiency of the pump. All points to the right or left of the have a lower efficiency (see Figure 4-4). The impeller is subject to axial and radial forces, which get greater the further away the operating point is from the These forces manifest themselves as vibration depending on the speed and construction of the pump.
8 The point where the forces and vibration levels are minimal is at the In selecting a pump, one of the concerns is to optimize pumping efficiency. It is good practice to examine several performance charts at different speeds to see if one model satisfies the requirements more efficiently than another. Whenever possible the lowest pump speed should be selected, as this will save wear and tear on the rotating parts. Figure 4-4 Typical performance curve for a specific impeller diameter. 4 4 PUMP SELECTION, SIZING AND INTERPRETATION OF PERFORMANCE curves Note: The pump performance curves are based on data generated in a test rig using water as the fluid.
9 These curves are sometimes referred to as water performance curves . The use of these curves for fluids with a different viscosity than water can lead to error if the proper correction factors are not applied. These correction factors are applied to the Total Head, the flow and the efficiency of the pump, and are published in form of curves by the Hydraulic Institute (see Standards book published by the Hydraulic Institute, web site: and for the correction factor charts see the web site ). Horsepower curves The horsepower curves are shown on the chart and give the power required to operate the pump within a certain range.
10 For example (see Figure 4-5), all points on the performance curve to the left of the 2 hp curve will be attainable with a 2 hp motor. All points to the left of 3 hp curve and to the right of the 2 hp curve will be attainable with a 3 hp motor. The horsepower can be calculated with the Total Head, flow and efficiency at the operating point. (More on horsepower calculations and operating point later). Note that the horsepower curves shown on the performance curves are valid for water only. Figure 4-5 Coverage area of horsepower curves . Requirement curves The pump manufacturer specifies a minimum requirement on the in order for the pump to operate at its design capacity.