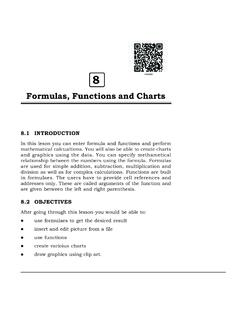
Transcription of Chapter 16 - Gantt Charts
1 Microsoft Visio 2010 - Module 1 Watsonia Publishing Page 141 Chapter 16 - Gantt Charts Chapter 16 Gantt Charts Gantt Charts are graphical representations of task-based projects. The tasks in a Gantt chart are both listed in a tabular format and displayed graphically as task bars, reflecting their duration. By linking related tasks, Visio can automatically adjust the timeline when tasks are delayed or completed before schedule. Hence, Gantt Charts are the ideal tool to use if you are responsible for scheduling a project and tracking the duration of each of the tasks in the project to ensure the project is completed on time. In this session you will: gain an understanding of Gantt Charts gain an understanding of Gantt chart options learn how to create a Gantt chart learn how to complete task details learn how to create subtasks learn how to link and unlink tasks learn how to add and delete tasks learn how to display and hide columns learn how to format task bars learn how to navigate a Gantt chart learn how to export Gantt chart data learn how to import data into a Gantt chart learn how to print Gantt Charts .
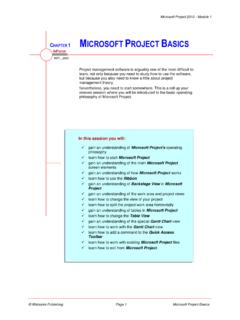
2 INFOCUS WPL_V515 Microsoft Visio 2010 - Module 1 Watsonia Publishing Page 142 Chapter 16 - Gantt Charts UNDERSTANDING Gantt Charts 1 Projects usually comprise multiple tasks. When you manage a project it can be difficult to track the tasks, their relationships, duration and status. A change in one task can affect the progression of a project and it is therefore important to have an overview of that project. Gantt Charts are bar Charts that depict activities in a project, their duration and their interrelationships. The individual tasks are listed in the Task Name column. A task is automatically formatted as bold when a task below it is indented. The bolding indicates that the task is a summary task and the indented tasks below it are subtasks of the summary task. Note that you cannot edit the duration of a summary task, only its subtasks. The Start date determines the start position of the task bar.
3 The Finish date determines the end position of the task bar. The Duration of a task determines the length of the task bar. You can either enter the Duration or let Visio calculate it by typing a Start and Finish date. Type the Duration as a number followed by w for weeks, d for days, h for hours, or m for minutes (for example, 3d for 3 days). A task with a duration value of zero is a milestone (see task 8 Go to Airport above). The % Complete indicates the progress of a task. The value is highlighted in the task bar to give additional graphical information. This column may not be showing by default, but can be added in manually. The percentage complete is reflected in the task bar by a proportion of the task bar appearing in a different colour, see tasks 1 and 2 above. Linked tasks are connected by connector lines. By connecting tasks, if the end date of one task changes, the connected tasks will automatically adjust to reflect the impact on the progress of the project.
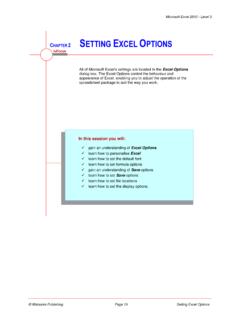
4 Each task is represented graphically by a task bar. This makes it much easier to gauge the progress of a project. 2 3 4 5 6 7 8 9 Microsoft Visio 2010 - Module 1 Watsonia Publishing Page 143 Chapter 16 - Gantt Charts Gantt chart OPTIONS 1 When you are creating a new Gantt chart , there are a number of options that you need to select to determine the level of detail in the resulting chart . These options control the size of the chart , duration, duration format and the date range. While they can be changed after you have created the chart , you will finish your chart much earlier if you plan the layout first. The number of tasks option is only available when you are first creating a Gantt chart . Once this dialog box has been activated and the Gantt chart created, you cannot create additional tasks by using this option. Instead, you must either click on New or drag the Row shape from the Shapes window to add extra tasks.
5 The Format determines the way in which the values will display in the Duration column of the Gantt chart . Durations are displayed as w for weeks, d for days, h for hours, and m for minutes (preceded by the number of those units). The Timescale range determines the period of time displayed in the Gantt chart . The start time and finish time fields are only available if Hours has been selected in Minor units. The Time units determine the level of detail where the task bars are displayed on the Gantt chart . In the Gantt chart , there are two levels of headings where the task bars are displayed. The top heading is determined by the Major units selected in the dialog box and the lower headings are determined by the Minor units selected. 2 3 4 1 2 3 4 Microsoft Visio 2010 - Module 1 Watsonia Publishing Page 144 Chapter 16 - Gantt Charts CREATING A Gantt chart Try This Yourself: Before starting this exercise ensure no files are open in Click on the File tab, click on Schedule under Template Categories, click on Gantt chart and then click on [Create] The Gantt chart Options dialog box will open letting you set the basic setup options for your chart .
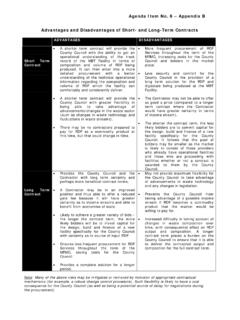
6 These options can be altered Type 7 in number of tasks The duration of the project will be a couple of weeks so you won t need to change the default settings in Duration options and Time units. But let s assume the project will start next Click on the drop arrow for Start date in Timescale range to display a calendar for the current month Click on the right arrow until April next year appears Click on a Monday Repeat steps 3 and 5 to change Finish date to the Wednesday two-and-a half weeks later Click on [OK] to create the Gantt chart For Your To create a new Gantt chart : 1. Select File > New > Schedule > Gantt chart 2. Select the required options 3. Click on [OK] Handy to If you need to change the start or finish date of the project detailed in a Gantt chart , open the Gantt chart Options dialog box by clicking on chart Options in the Manage group on the Gantt chart tab. 1 6 Visio includes a Gantt chart template that enables you to create a visual representation of the activities in a project along with their duration.
7 Because tasks can be linked to each other, the Gantt chart will automatically adjust if any tasks are delayed. You can then see the impact on the overall finish date of the project and take appropriate action if necessary. 7 Microsoft Visio 2010 - Module 1 Watsonia Publishing Page 145 Chapter 16 - Gantt Charts COMPLETING TASK DETAILS Try This Yourself: Same File Continue using the previous file or open V515 Gantt Zoom to 100%, then click on Task 1 in the Task Name column to select it Type Research Holiday Locations, then click on the Finish date for this task As the Start date for the first task is the date when the project starts, you won t need to change Type a date two days after the Start date (we ve typed 13/04/11 in our sample), then click on the Duration for this task The Duration will calculate automatically from the Start and Finish dates and the task bar will extend to 3 Complete the project details as shown including Task Names, and appropriate Start dates and Finish dates The task bars will appear in your chart based on the dates and durations you specify For Your To complete task details: 1.
8 Click on the task field to be edited 2. Type the required value Handy to If you know the duration of a task, you can either type a value in Duration or drag the blue handle on the task bar to the desired date. Visio will calculate the Finish date. To create a Milestone, or key date in a project, add a task with a Duration of zero. 1 2 When you create a new Gantt chart using the Gantt chart Options dialog box, Visio displays the specified number of tasks each with a default name, start date and duration. You can quickly name each task, adjust their individual start and finish dates, and indicate the expected duration for each task. The task bars in the chart will update to reflect your changes. 3 4 Microsoft Visio 2010 - Module 1 Watsonia Publishing Page 146 Chapter 16 - Gantt Charts CREATING SUBTASKS Try This Yourself: Same File Continue using the previous file or open the file V515 Gantt Click on the Gantt chart tab to open it This contextual tab contains all commands pertinent to Gantt Click on the Book Tickets task to select it You can select multiple tasks, if desired, by pressing and clicking on each Click on Indent in the Tasks group The task will be demoted (indented) to a subtask.
9 The task immediately above the subtask will be bolded as Visio assumes this is the summary Repeat step 3 to indent the Pay Agent task Both of these tasks are now subtasks of the Contact Travel Agent task. The formatting of the summary task s task bar will change to include triangle symbols at the start and end of the bar For Your To create subtasks: 1. Select the task/s to demote 2. Click on Indent in the Tasks group on the Gantt chart tab Handy to If you want to remove the subtask property from a task, select the task/s and click on Outdent . The subtasks determine the Duration of the summary task. As a result of this, you cannot alter the Duration of a summary task (hence the bold formatting), only its subtasks. 2 3 If you have a task in a project that comprises a number of other tasks, then you can break down the parent task into subtasks and thereby track each individual aspect of the parent task.
10 When you identify a task as being a subtask, the parent task is referred to as a summary task and it is formatted bold in the Gantt chart to indicate its status. The summary task and subtasks are linked. 4 Microsoft Visio 2010 - Module 1 Watsonia Publishing Page 147 Chapter 16 - Gantt Charts LINKING AND UNLINKING TASKS Try This Yourself: Same File Continue using the previous file or open the file V515 Gantt Click on the first task bar in the Gantt chart to select it Press and click on the Book Tickets task bar You cannot book the tickets before you ve decided where to go for your Click on Link in the Tasks group Press to see the link more clearly A connector will be drawn between the two linked Select the two task bars again Unlinking tasks is also a simple Click on Unlink to remove the link The link will now Complete the links as shown Note that you will have to link Book Tickets to each of the three tasks on April 18th individually For Your To link tasks: 1.