Transcription of Chapter 2: Data Representation and Data Reduction
1 DATABASESYSTEMSGROUPK nowledge Discovery in Databases I: data Representation1 Knowledge Discovery in DatabasesSS 2016 Lecture: Prof. Dr. Thomas SeidlTutorials: Julian Busch, Evgeniy Faerman,Florian Richter, Klaus SchmidLudwig-Maximilians-Universit t M nchenInstitut f r InformatikLehr-und Forschungseinheit f r DatenbanksystemeChapter 2: data RepresentationandData ReductionDATABASESYSTEMSGROUPO verview data Representation data types Comparisonandsimilarity data visualization data Reduction Aggregation GeneralizationKnowledge Discovery in Databases I: data Representation2 DATABASESYSTEMSGROUPO bjects carry information Objects and attributes Entity-Relationshipdiagram(ER) UML classdiagram data tables(relational model)Knowledge Discovery in Databases I: data , C,RBob1 CSJava, PHPC harly4 HistoryPiano,..Debra2 ArtsPainting, ..StudierendenamesemestermajorskillsStud ierendesemestermajorskillsnameDATABASESY STEMSGROUPO verviewof (attribute) datatypes Simple datatypes Numerical, categorical, ordinal Composeddatatypes Sets, sequences, vectors Complexdatatypes Multimedia: images, videos, audio, text, documents, web pages, etc.
2 Spatial, geometric: shapes, molecules, geography, etc. Structures: graphs, networks, trees, etc. Examplesforcomplexobjects Molecules: shape+ structure+ physical-chemicalproperties+ .. City maps: shapes+ trafficnetworks+ pointsof interests+ .. Mechanicalparts: shape+ physicalproperties+ Discovery in Databases I: data Representation6 DATABASESYSTEMSGROUPS imple datatypesand comparisons Numeric data Numbers: natural, integer, rational, real numbers Examples: age, income, shoesize, height, weight Comparison: difference Example: 3 ismoresimilarto30 thanto3,000 Generalization: metricdata Metricspace , consistsof objectset and metricdistance Comparisonby(metric) distance : 0+ Symmetry: , : , = , Identity of indiscernibles , : , =0 = Triangleinequality , , : , , + , Example: pointsin 2D space EuclideandistanceKnowledge Discovery in Databases I: data Representation7 DATABASESYSTEMSGROUPS imple datatypesand comparisons Numericdata, metricdata Categoricaldata Just identifiers Exampleoccupation= {butcher, hairdresser, physicist, physician.}
3 } Examplesubjects= {physics, biology, math, music, literature, history, EE, .. } Comparison: howtocomparevalues??? Trivial metric: , = 0 = 1 Alwaysworksbut isquitecoarse Generalizationhierarchiescanhelp Path lengthseemsappropriate , =2 , =4 , =0 Knowledge Discovery in Databases I: data datatypesand comparisons Numeric data , metricdata Categoricaldata, hierarchicaltypes Ordinaldata Somedatacarry a (total) order , Transitivity , , : Antisymmetry , : = Totality , : Examples Numbers3 30 3,000 Wordshigh highschool highscore( , lexicographicalorder) Frequencies Howoftendidyousleepbadlast year? never seldom rarely occasionally sometimes often frequently regularly usually always (Vague) sizes Howbigwas thatproblem? tiny small medium big hugeKnowledge Discovery in Databases I: data Representation9 DATABASESYSTEMSGROUPC omposeddatatypes Sets Putindividual valuestogether Example: =.
4 Comparison Symmetricsetdifference: , = = Jaccarddistance: , = Bitvectorrepresentationof a seton a given, orderedbaseset Sample base = , , , , , , Examplesets = , , =1,0,0,0,1,0,1 = , , , =1,1,0,0,0,1,1 Hammingdistance= sumof different entries: , =3 EqualsthesymmetricsetdifferenceKnowledge Discovery in Databases I: data Representation11 DATABASESYSTEMSGROUPC omposeddatatypes Sequences, vectors Put valuesof a domain together Order doesmatter: I foran indexset =1,.., Comparisonof vectors: twosteps Determineindividual differences , or distances , Combine individual distancestooveralldistance , Examples (Simple) sum: 1 , = =1 (Manhattan) Root of sumof squares: 2 , = =1 2(Euclidean) Maximum: , =max =1,.., (Maximum) General formula: , = =1 (Minkowski) WeightedMinkowskidist.: , , = =1 Knowledge Discovery in Databases I: data Representation12 DATABASESYSTEMSGROUPC omplexdatatypes Components Structure: graphs, networks, trees Geometry: shapes/ contoures, routes/ trajectories Multimedia: images, audio, text, etc.
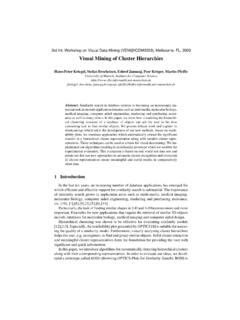
5 Similaritymodels: approaches Directmeasures highlydatatype dependent Feature extraction explicit vectorspaceembedding Kernel trick implicitvectorspaceembedding ExamplesforsimilaritymodelsKnowledge Discovery in Databases I: data Representation13 ExamplesDirectdistanceFeature-basedKerne l-basedGraphsStructuralalignmentDegreehi stogramsLabelsequencekernelGeometryHausd orffdistanceShape histogramsSpatialpyramidkernelSequencesE dit distanceSymbolhistogramsCosinedistanceDA TABASESYSTEMSGROUPF eature extraction Objects fromdatabaseDB aremappedtofeaturevectors Feature vectorspace Points representobjects Distancecorrespondsto(dis-)similarityKno wledge Discovery in Databases I: data Representation14graygreenmarin ..90877846graygreenmarin ..2093graygreenmarin ..grayredmaringreenyellowpurpleFeature extractionDBDATABASESYSTEMSGROUPS imilarityqueries similarity queriesarebasicoperationsin (multimedia) databases Givena universe , database , distancefunction , andqueryobject : Range queryforrangeparameter 0+: , , , = , Nearestneighborquery: , , = : , , -nearestneighborqueryforparameter : , , , , , , = , , , , , , , : , , Ranking query(partial sortingquery): getnext functionalityforpickingdatabaseobjectsin an increasingorderwrt.
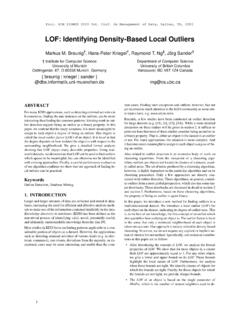
6 Totheirdistanceto : : , , , , , , Knowledge Discovery in Databases I: data Representation15 1 2 3 DATABASESYSTEMSGROUPS imilaritySearch Example rangequery , , , = , Naive searchbysequentialscan Fetchdatabaseobjectsfromsecondarystorage (disk, ): Check distancesindividually: Fast searchbyapplyingdatabasetechniques Filter-refinearchitecture Filter: Boildatabase down to(small) candidateset . Refine: Applyexactdistancecalculationtocandidate sfrom only. Indexingstructures Avoidsequentialscansby(hierarchicaloroth er) indexingtechniques data accessin (fast) , log oreven 1 Knowledge Discovery in Databases I: data Representation16 DATABASESYSTEMSGROUPICESF ilter-refinearchitecture Principle ofmulti-stepsearch Fast filterstepproducescandidateset (byapproximatedistancefunction ) Exactdistancefunction iscalculatedon candidateset only. Example: dimensionalityreduction[GEMINI: Faloutsos1996; KNOP: Seidl&Kriegel1998] ICES criteriaforfilterqualityndexable Index enabledomplete Nofalsedismissalsfficient Fast individual calculationelective Small candidateset[Assent, Wenning, Seidl: ICDE 2006]17 Knowledge Discovery in Databases I: data RepresentationDATABASESYSTEMSGROUPI ndexing Organizedatain a waythatallowsforfast accesstorelevant objects, byheavy pruning.
7 R-Treeasan exampleforspatialindexstructure Hierarchyofminimumboundingrectangles Disregardsubtreeswhicharenot relevant forthecurrentqueryregion18 Thomas SeidlDATABASESYSTEMSGROUPO verview data Representation data types Comparisonandsimilarity data visualization data Reduction Aggregation GeneralizationKnowledge Discovery in Databases I: data Representation20 DATABASESYSTEMSGROUPData visualization Patterns in large datasetsarehardlyperceivedfromtabularnum ericalrepresentations data visualizationtransformsdatain visuallyperceivablerepresentations( a pictureiswortha thousandwords ) Combine capabilities Computersaregoodin numbercrunching(anddatavisualizationbyme ansofcomputergraphics) Humansaregoodin visualpatternrecognition21 Monthlyaveragetemperature[ C]St dte JanFebMrzAprMaiJunJulAugSepOktNovDezAbu Dhabi252731364041424342373127 Acapulco323132323333333333333232 Anchorage-4-20613171817135-3-5 Antalya151619222732353632272117 Athen131417202630343429241814 Atlanta111318232630313128231712 Bangkok323335363534333333323232 Bogota201919191918181819191920 Buenos Aires302826231916151719212629 Caracas302830303132323233323130 Casablanca181820212225262726242119 Chicago0191621262928241792 Colombo (Sri Lanka)
8 313132323231313131313131 Dallas131621252933363632261914 Denver781414212832302518126 Faro(Algarve)161619212327292926231917 Grand Canyon (Arizona)681315212729272518126 Harare272627262421222428292827 Helsinki-3-3291520232117930 Heraklion(Kreta)151618202427303027242017 Hongkong192023263032333332302521 Honolulu262627272830303130302827 Houston161923273033343532282117 Irkutsk-14-91916232421167-4-13 Istanbul9913172327303026201511 Jakutsk (Nordostsibirien)-35-28-1031423262111-3- 25-34 Johannesburg252524222017172024252525 Kairo192024273235353534302520 Kapstadt272726242118181819222426 Kathmandu182125282829282828262320 Larnaka(Zypern)171820232631333431282319 Las Palmas212022232425272828272422 Las Vegas151623263138403935272014 Lhasa91013172124232221171310 Lima262627242120191819202224 Lissabon141518202327282927221715 Los Angeles191819192222242525232119 Madeira191820202124252626252220 Madrid111317192431343328211411 Malaga171719222529323128242018 Mallorca151518202429313228241916 Marrakesch192024262935383832292320 Mexico City212325272726242423232222 Moskau-4-4311192325231791-2 Neu Delhi202431364039363434332823 New York441016212730282518127 Palermo151417192327293027241916 Peking (Beijing)261320273032312619103 Perth (Australien)323131262320182020242730 Reykjavik2346913151411742 Rio de Janeiro303030282626252526272729 Rom131316192327302927221714 San Francisco141517182022222224211714 Santiago de Chile302728241916151719222628 Santo Domingo (Karibik)302930303131323232323130 Shanghai81014192527333228231710 Singapur303132323232313131323130 Sydney (Australien)
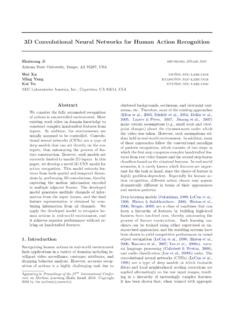
9 272625232018181922232525 Teneriffa S d222123232425282828272523 Tunis161619222731343430272118 Windhoek312929272523222529313132 Knowledge Discovery in Databases I: data Representation data VisualizationDATABASESYSTEMSGROUPData Visualization: Techniques Geometric Techniques Idea: Visualization of geometric transformations and projections of the data Examples: Scatterplots, Parallel Coordinates Icon-based Techniques Idea: Visualization of data as icons Examples: Chernoff Faces, Stick Figures Pixel-oriented Techniques Idea: Visualize each attribute value of each data object by one colored pixel Example: Recursive Patterns Other Techniques: Hierarchical Techniques, Graph-based Techniques, Hybrid-Techniques, ..Knowledge Discovery in Databases I: data Representation data Visualization22 Slide credit: Keim,Visual Techniques for Exploring Databases, Tutorial Slides, KDD Plot Displays all of the data (allowing the user to assess both the overall behavior and unusual occurrences) Plots quantile information The -quantile indicates the value for which the fraction of all data is less than or equal to (called percentile if is a percentage).
10 , median = 50%-quantile or Discovery in Databases I: data Representation data price ($)f-valueDATABASESYSTEMSGROUPQ uantile-Quantile (Q-Q) Plot Graphs the quantiles of one univariate distribution against the corresponding quantiles of another Allows the user to view whether there is a shift in going from one distribution to anotherKnowledge Discovery in Databases I: data Representation data Visualization24 DATABASESYSTEMSGROUPS catter plot & Loess Curve25 Provides a first look at bivariate data to see clusters of points, outliers, etc. Each pair of values is treated as a pair of coordinates and plotted as points in the planeLoess Curve (local regression) Adds a smooth curve to a scatter plot in order to provide better perception of the pattern of dependence Loess curve is fitted by setting two parameters: a smoothing parameter, and the degree of the polynomials that are fitted by the regressionKnowledge Discovery in Databases I: data Representation data VisualizationDATABASESYSTEMSGROUPS catterplot Matrix Matrix of scatterplots (x-y diagrams) of -dimensional data Indicates correlations in pairs of dimensions Ordering of dimensions is important Dimension reordering helps to better understand the structures in the data and reduces clutter The interestingness of different orderings can be evaluated with quality metrics ( Peng et al.)