Example: confidence
CHAPTER 2: NUMERICAL & GRAPHICAL SUMMARIES OF …
Page 1 CHAPTER 2: NUMERICAL & GRAPHICAL SUMMARIES OF QUANTITATIVE DATA FREQUENCY DISTRIBUTIONS AND HISTOGRAMS A HISTOGRAM is a bar graph displaying quantitative (numerical) data
Tags:
Information
Domain:
Source:
Link to this page:
Documents from same domain
NANDA-APPROVED NURSING DIAGNOSES - …
www.deanza.eduNANDA-APPROVED NURSING DIAGNOSES 2018-2020 Grand Total: 244 Diagnoses August 2017 Indicates new diagnosis for 2018-2020--17 total Indicates revised diagnosis for 2018-2020--72 total

W 301 Balancing Equations Worksheet - deanza.edu
www.deanza.eduW 301 Everett Community College Tutoring Center Balancing Equations Worksheet - Solutions . 1) _1_ H 3PO 4 + _3__ KOH Æ _1__ K 3PO 4 + _3__ H 2O . 2) _6__ K + _1__ B ...
NANDA-APPROVED NURSING DIAGNOSES
www.deanza.eduNANDA-APPROVED NURSING DIAGNOSES 2015-2017 ... Self-Care, Readiness for Enhanced 183. Self-Care Deficit, Bathing 184. Self-Care Deficit, Dressing 185. Self-Care Deficit, Feeding ... Sleep, Readiness for Enhanced 203. Sleep Deprivation 204. Sleep …

Camus, “Sisyphus” Taylor, “The Meaning of Life”
www.deanza.eduCamus, “Sisyphus” Taylor, “The Meaning of Life” Camus Sis’ punishment is the worst imaginable—futile and hopeless labor. -is that the worst thing we can think of?
Transfer to All Campuses - UC/CSU Intersegmental General ...
www.deanza.eduTransfer to All Campuses - UC/CSU Intersegmental General Education Transfer Curriculum (IGETC) for 2018-2019 Effective: Fall 2018 through Summer 2019

DNA Replication & Protein Synthesis
www.deanza.eduDNA Replication and Repair A cell copies its DNA before mitosis or meiosis I DNA repair mechanisms and proofreading correct most replication errors. Semiconservative DNA Replication Each strand of a DNA double helix is a template ... DNA called genes

1. What is Cultural Relativism? 2. Is Cultural Relativism ...
www.deanza.eduCultural Relativism Is it true? The Cultural Differences Argument: P1 Different cultures have different moral codes C Therefore, there is no objective “truth” in morality. Right and wrong are only matters of opinion, and opinions vary from culture to culture. This argument is not sound, because it is not valid.It is possible

Basic Essay Format
www.deanza.eduThe introduction guides your reader into the paper by introducing the topic. It should begin with a hook that catches the reader’s interest. This hook could be a quote, an analogy, a question, etc. After getting the reader’s attention, the introduction should give some background information on the topic. The ideas within the introduction

Estimating Population Size & Distribution
www.deanza.edu74 Exercise 3.C. Estimating Population Size & Distribution An alternative approach is to measure ecological density, expressed in numbers of individuals per resource unit (numbers of ticks per deer, for example, or numbers of maggots per apple). Determining Distribution

Socialization and Child Development
www.deanza.eduSocialization The process by which human beings acquire the knowledge, skills and character traits that enable them to participate as effective members of groups ... family, peer group, classroom, neighborhood, and sometimes a church, temple, or mosque as well. Microsystem (primary ecology)
Related documents

Hybrid Statistics Frequency Distributions and Their Graphs
faculty.southwest.tn.eduHybrid Statistics – Chapter 2 Section 2.1 – Frequency Distributions and Their Graphs Objectives: Construct frequency distributions Construct frequency histograms ... Graphs of Frequency Distributions Frequency Histogram A bar graph that represents the frequency distribution.

Describing Data: Frequency Distributions, and Graphic ...
staff.uob.edu.bhDescribing Data: Frequency Distributions, and Graphic Presentation McGraw-Hill/Irwin ©The McGraw-Hill Companies, Inc. 2008 Chapter 2. Constructing a Frequency Distribution Step 1: order data Step 2: The number of classes(k). A useful rule “2 to the k rule.” such that
Chapter 2 Describing Variables - University of Minnesota
users.soc.umn.eduChapter 2 Describing Variables 2.1 Frequency Distributions for Discrete and ... 2.3 Graphing Frequency Distributions. Frequency Distributions Frequency distribution: a table of outcomes (response categories) of a variable and the number of times [tally or count] each outcome is observed.
Chapter 2 Describing Data: Frequency Distributions and ...
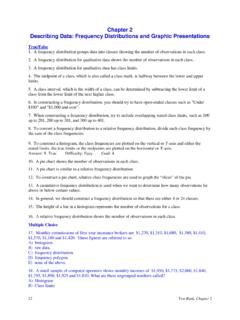
fac.ksu.edu.sa12 Test Bank, Chapter 2 Chapter 2 Describing Data: Frequency Distributions and Graphic Presentations True/False 1. A frequency distribution groups data into classes showing the number of observations in each class.

Chapter (2) Describing Data Frequency Distributions and ...
fac.ksu.edu.saChapter (2) Describing Data Frequency Distributions and Graphic Presentation Examples Frequency Table for Qualitative Data (nominal) Example (1): We select SRS consists of 52 books that display the color of the cover ... 2 Class Frequency Midpoint 18 ...

Chapter 2: Frequency Distributions and Graphs Section 2 ...
herrerosmath.weebly.comChapter 2: Frequency Distributions and Graphs Section 2: Histograms Worksheet 1. The data shown are the number of grams per serving of 16 selected brands of cakes. Construct a grouped frequency distribution using 5 classes. Construct a histogram.
Chapter 3 Frequency Distributions - psy210.faculty.unlv.edu
psy210.faculty.unlv.edu38 Chapter 3 Frequency Distributions intervals (exactly how many intervals is a matter of judgment, deciding which number of class intervals presents the data in the most informative manner). Six steps are involved in creating a grouped frequency distribution: STep 1 Range.

Chapter 2: Frequency Distributions and Graphs (or making ...
math.ucdenver.eduCh2: Frequency Distributions and Graphs Santorico -Page 27 Section 2-1 – Organizing Data Data must be organized in a meaningful way so that we can use it effectively.

Chapter 2: Frequency Distributions and Graphs Read ...
math.tntech.edu• Step 2: • Step 3: • Step 4: Find the percentage of values in each class by using the formula % = f n, where f - frequency in the class n - total number in the class.

Chapter 2
apstatsmonkey.comChapter 2: The Normal Distributions 4. Dra w a histogram that might r esult fr om taking random n umbers fr om 0 to 5 fr om a UNIFORM distribution. Then dra w a density cur ve (on a ne w set of ax es) that "idealizes" this histogram.
Related search queries
Hybrid Statistics Frequency Distributions and Their, Chapter 2, Frequency Distributions, Frequency, Frequency Distributions Frequency, Describing Data: Frequency Distributions, and, Describing Data: Frequency Distributions, and Graphic Presentation, Chapter 2 Describing Variables, Chapter 2 Describing Variables 2, Chapter 2 Chapter 2, Chapter, Frequency Distributions and Graphic Presentation Examples Frequency, Chapter 2: Frequency Distributions and Graphs Section 2, Chapter 2: Frequency Distributions, Chapter 2: Frequency Distributions and Graphs Read, Distributions