Transcription of CHAPTER 3 Distributed-Lag Models - Reed College
1 CHAPTER 3 Distributed-Lag Models A Distributed-Lag model is a dynamic model in which the effect of a regressor x on y occurs over time rather than all at once. In the simple case of one explanatory variable and a linear relationship, we can write the model as ()0,ttts tstsyLx uxu == + + = + + ( ) where ut is a stationary error This form is very similar to the infinite-moving-average representation of an ARMA process, except that the lag polynomial on the right-hand side is applied to the explanatory variable x rather than to a white-noise process.
2 The individual coefficients s are called lag weights and the collectively comprise the lag distribution. They define the pattern of how x affects y over time. We cannot, of course, estimate an infinite number of coefficients in ( ). One practical method is to truncate the lag in ( ) to finite length q, which is appropriate if the lag distri-bution is effectively zero beyond q periods. Another approach is to use a functional form that allows the lag distribution in ( ) to decay gradually to zero. We saw above that a stationary autoregressive process can be expressed as an infinite moving average with declining lag weights, so a form with one or more lags of y on the right-hand side will allow infinite-length lag distributions while requiring estimation of only a small number of parameters.
3 One difficulty that is common to all Distributed-Lag Models is choice of lag length, whether this be choosing the point q at which to truncate a finite lag distribution in ( ) or choosing how many lagged dependent variables to include. We defer this question until later in the CHAPTER , after various Distributed-Lag Models have been introduced. Dynamic effects of temporary and permanent changes In cross-sectional Models , we often used econometric methods to estimate the marginal effect of an independent variable x on the dependent variable y, holding all of the other inde-pendent variables constant: /yx.
4 In time-series Models , we must consider not only how 1 We assume that yt does not depend on future values of x, thus we exclude negative values of s from the summation. However, it is theoretically possible to have negative lags on the right-hand side, for example, people might change their behavior now if they know that a law is going to change in the future . Equation ( ) can be modified appropriately for such circumstances. 36 CHAPTER 3: Distributed-Lag Models much effect x has on y, but when it has the effect.
5 Is the effect immediate? Does it emerge slowly? Is there an initial effect that goes away after a few periods? In order to answer these questions, we must estimate the lag distribution relating y to x. Instead of a single expression /yx , the effects of x on y in a dynamic model are a se-quence of expressions, /,0, 1, 2, ..tstyxs+ =, that describe the effect of a change in x in period t on the value of y in periods t, t + 1, t + 2, etc. When the model is written in the form of equation ( ), the dynamic effects correspond to the lag weights of the (possibly) infinite moving-average representation: tststtsyyxx+ ==.
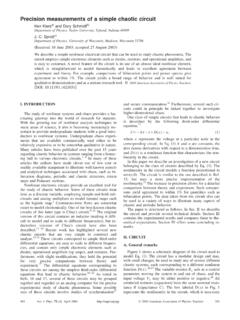
6 ( ) Note that the first equation in ( ) requires that the time-series relationship between y and x be stationary, so we can think of s either as the effect of current xt on future yt + s or as the effect of past xt s on current yt. When reporting the results of a lag regression it is common to express the lag weights either in a table, on a graph, or both. Suppose that we estimate a finite distributed lag with weights of 4, 2, and For this example, equation ( ) becomes tyxxx u = + + ++. ( ) We might show the lag weights for equation ( ) in a graph similar to Figure 3-1.
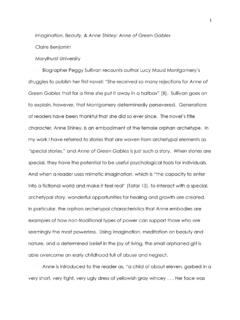
7 Figure 3-1. Graph of lag distribution of x on y Lag CHAPTER 3: Distributed-Lag Models 37 To see the interpretation of the lag weights, we consider two special cases: a temporary change in x and a permanent change in x. Suppose that x increases temporarily by one unit in period t, then returns to its original lower level for periods t + 1 and all future periods. For the temporary change, the time path of the changes in x looks like Figure 3-2: the change is zero except in period t, where it is one. Figure 3-2. Temporary change in x In period t, xt is increased by one unit but all earlier x values are unchanged.
8 From equa-tion ( ), we see that yt increases by 4 when xt goes up by one with xt 1, xt 2, and the dis-turbance term ut unchanged. We call this immediate effect yt/ xt = 0 the impact effect of x on y. In period t + 1, equation ( ) is advanced one period to become x xu++ += ++ ++ ( ) Given that xt + 1, xt 1, and the disturbance are unchanged, the change in y in period t + 1 is 2, the coefficient on the first lag of x ( 1). This is the dynamic marginal effect of x on y at one lag. By similar analysis, we can see that the effect of the temporary change in x at time t on yt + 2 is 2 = From this example we can see that the pattern of dynamic marginal effects of a tempo-rary change in x on y is given by the coefficients of the lag distribution s that are shown in Figure 3-1.
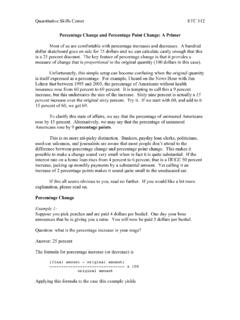
9 - 2t - 1tt + 1t + 2t + 3 Change in x Time 38 CHAPTER 3: Distributed-Lag Models Now consider the case of a permanent increase in x at time t: x increases by one unit in period t and remains higher in all periods after t than it was before t. This change is graphed in Figure 3-3. Figure 3-3. Permanent change in x Once again, from equation ( ) we see that the effect of the change in xt on yt is 4, be-cause xt 1, xt 2, and ut are assumed unchanged. Moving forward to period t + 1, the analysis of equation ( ) is different from the temporary change because now xt + 1 as well as xt is in-creased by one unit.
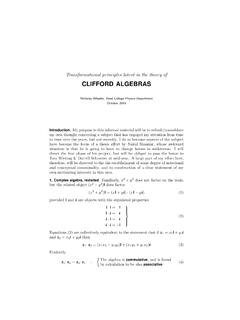
10 The cumulative effect on yt + 1 is 4 + 2 = 0 + 1 = 6. We call this the cu-mulate effect of x on y at one lag. At two lags, we advance equation ( ) one more period for-ward and now see the effects of the increased levels of xt + 2, xt + 1, and xt raising yt + 2 by 4 + 2 + = units. Moving one more period into the future , the effect on yt + 3 will be the same as the effect on yt + 2 because once again all of the x terms on the right-hand side are increased by one unit. The time path of the cumulative effects is shown in Figure 3-4, with the cumulative effect staying at for all lags starting at 2.