Transcription of Checking normality in SPSS
1 Community project encouraging academics to share statistics support resources All stcp resources are released under a Creative Commons licence Peter Samuels and Ellen Marshall Reviewer: Jamal Lahmar Birmingham City University and Sheffield Hallam University University of Sheffield stcp-marshallsamuels-normalityS Checking normality for parametric tests in SPSS One of the assumptions for most parametric tests to be reliable is that the data is approximately normally distributed. The normal distribution peaks in the middle and is symmetrical about the mean. Data does not need to be perfectly normally distributed for the tests to be reliable. Checking normality in SPSS Data: The SPSS dataset NormS contains the variables used in this sheet including the exercises. To check if a variable is normally distributed use Analyze Descriptive Statistics Explore: Graphical methods for assessing if data is normally distributed Plotting a histogram of the variable of interest will give an indication of the shape of the distribution.
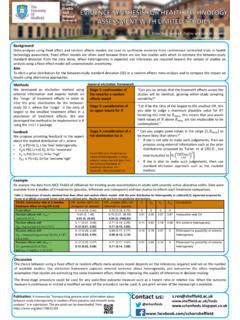
2 A normal approximation curve can also be added by editing the graph. Below are examples of histograms of approximately normally distributed data and heavily skewed data with equal sample sizes. Select the button and the normality plots with tests and the Histogram options The following resources are associated: statistical hypothesis testing worksheet and normality Checking example solutions worksheet Workshop 7: SPSS and Workshop 8: Parametric testing , SPSS dataset NormS When carrying out tests comparing groups, t-tests, normality checks should be carried out separately for each group: put the appropriate grouping variable in the Factor List Checking normality in SPSS statstutor community project Histogram of approximately normally distributed data Histogram of skewed data Note.
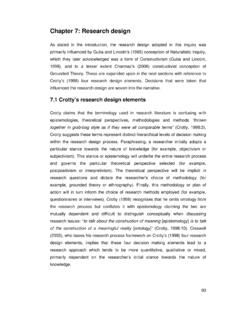
3 Normal curves can be added to histograms by double-clicking on them and using the button in the Chart Editor window. It is very unlikely that a histogram of sample data will produce a perfectly smooth normal curve like the one displayed over the histogram, especially if the sample size is small. As long as the data is approximately normally distributed, with a peak in the middle and fairly symmetrical, the assumption of normality has been met. The normal Q-Q plot is an alternative graphical method of assessing normality to the histogram and is easier to use when there are small sample sizes. The scatter should lie as close to the line as possible with no obvious pattern coming away from the line for the data to be considered normally distributed. Below are the same examples of normally distributed and skewed data. Q-Q plot of approximately normally distributed data Q-Q plot of skewed data Note: Alternative methods of measuring non- normality include comparing skewness and kurtosis values with their standard errors which are provided in the Explore output see the workshops on SPSS and parametric testing .
4 Tests for assessing if data is normally distributed There are also specific methods for testing normality but these should be used in conjunction with either a histogram or a Q-Q plot. The Kolmogorov-Smirnov test and the Shapiro-Wilk s W test determine whether the underlying distribution is normal. Both tests are sensitive to outliers and are influenced by sample size: For smaller samples, non- normality is less likely to be detected but the Shapiro-Wilk test should be preferred as it is generally more sensitive Checking normality in SPSS statstutor community project For larger samples ( more than one hundred), the normality tests are overly conservative and the assumption of normality might be rejected too easily (see robust exceptions below).
5 Any assessment should also include an evaluation of the normality of histograms or Q-Q plots as these are more appropriate for assessing normality in larger samples. hypothesis test for a test of normality Null hypothesis : The data is normally distributed For both of these examples, the sample size is 35 so the Shapiro-Wilk test should be used. For the skewed data, p = suggesting strong evidence of non- normality . For the approximately normally distributed data, p = , so the null hypothesis is retained at the level of significance. Therefore, normality can be assumed for this data set and, provided any other test assumptions are satisfied, an appropriate parametric test can be used. What if the data is not normally distributed? If the checks suggest that the data is not normally distributed, there are three options: Transform the dependent variable (repeating the normality checks on the transformed data): Common transformations include taking the log or square root of the dependent variable.
6 Use a non-parametric test: Non-parametric tests are often called distribution free tests and can be used instead of their parametric equivalent. Use a parametric test under robust exceptions: These are conditions when the parametric test can still be used for data which is not normally distributed and are specific to individual parametric tests see the appropriate test worksheet. Key non-parametric tests Parametric test What to check for normality Non-parametric test Independent t-test Dependent variable by group Mann-Whitney test Paired t-test Paired differences Wilcoxon signed rank test One-way ANOVA Residuals/ dependent variable by group Kruskal-Wallis test Repeated measures ANOVA Residuals at each time point Friedman test Pearson s correlation co efficient Both variables should be normally distributed Spearman s correlation coefficient Simple linear regression Residuals N/A Note: The residuals are the differences between the observed and expected values.
7 They are usually available in the Save options when carrying out a test. However, for ANOVA, residuals can only be obtained through the Analyze General Linear Model Univariate menu. Although non-parametric tests require fewer assumptions and can be used on a wider range of data types, parametric tests are preferred because they are more sensitive at detecting differences between samples or an effect of the independent variable on the dependent variable. This means Checking normality in SPSS statstutor community project that to detect any given effect at a specified significance level, a larger sample size is required for the non-parametric test than the equivalent parametric test when the data is normally distributed.
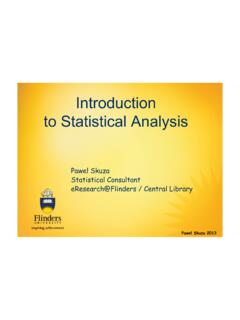
8 However, some statisticians argue that non-parametric methods are more appropriate with small sample sizes. Where to find non-parametric tests in SPSS Examples (see solutions below) Example 1: Class data has been collected on BMI (Ex1_BMI). Use graphical methods as well as tests to check normality of the variable Ex1_BMI. Example 2 A study was carried out to compare whether exercise has an effect on the blood pressure (measure in mm Hg). The blood pressure was measured on 15 people before and after exercising. The results are contained in Ex2_before and Ex2_after: Subject 1 2 3 4 5 6 7 8 9 10 Before 79 96 100 After 86 70 55 82 Carry out the relevant normality checks and determine which test is appropriate. Solutions Ex 1: The p-value for the Shapiro-Wilk test is suggesting that the data is not normally distributed. However, the histogram suggests that the data is approximately normal with one outlier.
9 With such a high BMI, this is likely to be a data entry error and therefore removed. Ex 2: This is paired data and therefore the paired differences should be checked for normality . Use Transform Compute Variable and calculate the difference between before and after. The Shapiro-Wilk test has a p-value of and the histogram is negatively skewed so a paired t-test is not appropriate. A Wilcoxon signed rank test should be used instead. For small sample sizes, it can be difficult to assess non- normality so non-parametric tests are recommended.