Transcription of Childbearing Differences Among Three Generations of U.S. …
1 NCHS Data Brief No. 68 August DEPARTMENT OF HEALTH AND HUMAN SERVICESC enters for Disease Control and PreventionNational Center for Health StatisticsChildbearing Differences Among Three Generations of women Sharon E. Kirmeyer, ; and Brady E. Hamilton, findings Of Three Generations of women born in 1910, 1935, and 1960, those born in 1935 had the most children (on average children per woman) and those born in 1960 had the fewest ( ). women born in 1910 and 1935 started their Childbearing at the youngest ages with an average or median age at first birth of 21 years; more than 70 percent of their first births occurred to women under age 25. The median age at first birth was oldest for the 1960 birth cohort (23 years). Thirty-seven percent of women born in 1935 had four or more children; women born in 1960 were the most likely to have two children (35 percent); and women born in 1910 were equally likely to have no, one, or two children (approximately 22 percent each).
2 Of these Three cohorts, women born in 1910 were the most likely to be childless by age 50 (20 percent), whereas those born in 1935 were the least likely (11 percent).Each year a generation of women is born who will share similar sociohistorical experiences before and throughout their reproductive lives. These unique experiences can produce similar Childbearing patterns in terms of the average number of children ever born whether mothers are younger or older when their first birth occurs and the proportion of women who do not have children that can differ from the patterns found for other cohorts. Childbearing patterns have profound consequences for society. These consequences include the demand for schools and housing, as well as women s participation in the labor force. Moreover, the lives of women who become mothers are significantly different from those who do not. Having children affects the acquisition of material goods and may impose costs for the mother in terms of personal and professional options.
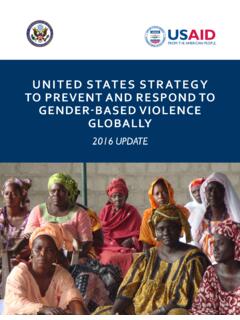
3 This report presents data on Three selected birth cohorts of women representing Generations born at 25-year intervals in 1910, 1935, and 1960, close to the average length of a generation in the United States (1). Data are from the cohort fertility tables, based on the National Vital Statistics : birth cohort childlessness total fertility rateWomen born in 1935 had on average Three births the highest of the Three per womanYear cohort completed fertility1910 cohort(estimated) NOTE: Based on total fertility rates for women aged 45 49. SOURCE: CDC/NCHS, National Vital Statistics 1. Cohort total fertility rates: United States, 1950 Data Brief No. 68 August 2011 2 The total fertility rate (TFR) for the 1935 birth cohort that is, the average number of children per woman was (Figure 1), the highest of the Three cohorts. In contrast, the lowest number was children per woman born in 1960. The TFR of women born in 1910 was between these rates at These Three Generations of women achieved their completed fertility close to the lowest and highest levels of the cohorts that completed their Childbearing in the last half-century.
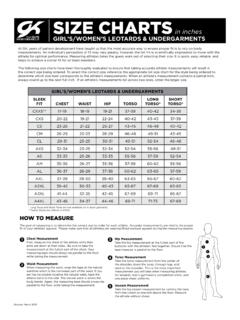
4 The TFRs peaked at children per woman in 1980 for the 1931 1935 cohort and troughed at children per woman in 2002 for the 1953 1957 born in 1960 started their Childbearing at an older age. Nearly Three -quarters of the first births born to members of the 1910 and 1935 cohorts occurred when the cohort was under age 25, compared with one-half of the births to mothers in the 1960 cohort. For women born in 1910 and 1935, having a first birth after age 30 was relatively rare (less than 10 percent of births) compared with close to 20 percent of births occurring to mothers born in 1960. women born in 1935 had the lowest average (median) age at first birth ( years) (2). The highest median age was for women born in 1960 (Figure 2). The 1910 cohort was between the other two cohorts, with a median age at first birth of : Access data table for Figure 2 at: # : CDC/NCHS, National Vital Statistics 49 years25 29 years20 24 years15 19 years196019351910 PercentBirth cohort yearFigure 2.
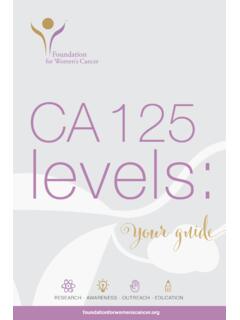
5 Age of mother at first birth, by birth cohort of mother: United States, 1910,1935, and 1960 NCHS Data Brief No. 68 August 2011 3 women born in 1935 had the highest number of children; women born in 1910 had the fewest children. women born in 1935 tended to have larger families, with four or more children being the most frequent outcome (37 percent) (Figure 3). women in the 1910 cohort were equally likely to have no, one, or two children (approximately 22 percent each) of the birth outcomes of that group. For women born in 1960, two births per family was most common (35 percent). They were the least likely of the Three cohorts to have four or more : Access data table for Figure 3 at: # : CDC/NCHS, National Vital Statistics of children0102030401960 cohort1935 cohort1910 cohort4 or more3210 Figure 3. Percent distribution of the number of children ever born, by birth cohort of mother: United States, 1910, 1935, and 1960 NCHS Data Brief No.
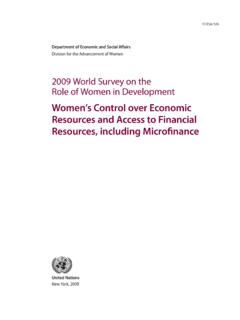
6 68 August 2011 4 women born in 1910 were almost twice as likely to be childless as women born in 1935. At age 50, the percentages of childless women in the selected birth cohorts were percent for women born in 1910, percent for women born in 1935, and percent for women born in 1960 (Figure 4). While Differences in the proportions childless in the Three cohorts were essentially constant for ages 40 and over, this was not true at earlier ages. women born in 1960 postponed their first births longer and were more likely to be childless in their 20s and early 30s compared with the other two cohorts. After age 40, the percentage childless for this cohort was between the levels for the cohorts of 1910 and 1935. SOURCE: CDC/NCHS, National Vital Statistics in yearsPercent0204060801001960 cohort1935 cohort1910 cohort4945403530252015 Figure 4. Percentage of women childless, by age and birth cohort of mother: United States, 1910, 1935, and 1960 NCHS Data Brief No.
7 68 August 2011 5 SummaryWomen born in 1910 had the highest proportion of childlessness and a corresponding low TFR. In contrast, women born in 1935 had both the lowest proportion of childlessness and the highest TFR. The fertility of women born in 1960 is characterized as generally between the two earlier cohorts in terms of childlessness, but is distinct with both the smallest average family size and the oldest age at first birth. First-time Childbearing is more concentrated Among younger women for the 1910 and 1935 cohorts than for the 1960 cohort. Finally, for all Three cohorts, at least 80 percent of women had a child by age distinct fertility patterns were a product of sociohistorical forces during these Generations reproductive lives. The Childbearing of the earliest cohort (1910) was largely affected by the Great Depression and World War II. The drop in marriages and uncertainty brought by those events lowered the likelihood of Childbearing (3).
8 women in the middle cohort (1935) started their reproductive lives after the end of the World War II when the number of marriages jumped, and the economy prospered (4). For a number of reasons, including the increases in women s educational and occupational opportunities (5) and availability of reliable means of fertility control (6), the fertility of the last cohort (1960) was delayed and resulted in a smaller family size than that of the two earlier cohort: Refers to a group of women born in the same year. Childlessness: Refers to the state of women who have not given birth to live-born total fertility rate (or average family size ): Refers to the number of births that a cohort of women had at the end of their Childbearing years, usually expressed as the average number of children per woman, but alternatively expressed as the average number of children per 1,000 women . It is the sum of fertility rates over all ages in a birth (or median) age at first birth: Refers to the point that separates the younger one-half (50 percent) of women who are having a first birth from the older Data Brief No.
9 68 August 2011 6 Data sources and methodsData shown in this report are based on the Natality Data Files of the National Vital Statistics System. The vital statistics natality file includes information for all births occurring in the United States and covers a wide range of maternal and infant demographic and health characteristics. Population data for computing the rates were provided by the Census sources for the information used in this report are Transitions Between Childlessness and First Birth: Three Generations of women , Fertility Tables for Birth Cohorts by Color: United States, 1917 1973, Cohort Fertility Tables for All, White, and Black women : United States, 1960 2005, and annual cohort fertility tables in the 1974 and 1999 Vital Statistics of the United States (2,7 10). Information on the cohort fertility tables and measures presented in this report is available elsewhere (2,7,8).About the authorsSharon E.
10 Kirmeyer and Brady E. Hamilton are with the Centers for Disease Control and Prevention s National Center for Health Statistics, Division of Vital Statistics, Reproductive Statistics Branch. NCHS Data Brief No. 68 August 2011 7 References1. Preston SH, Heuveline P, Guillot M. Demography: Measuring and modeling population processes. Oxford, UK: Blackwell Publishers Ltd. Kirmeyer SE, Hamilton BE. Transitions between childlessness and first birth: Three Generations of women . National Center for Health Statistics. Vital Health Stat 2(153). Glick PC. A demographer looks at American families. J Marriage Fam 37(1):15 26. Petersen W. Population, 3rd Edition. London, UK: Macmillan Publishing Company, Inc. Bureau of Labor Statistics. Changes in men s and women s labor force participation rates. The Editor s Desk. Washington, DC: Department of Labor. Mosher WD, Westoff CF. Trends in contraceptive practice: United States, 1965 76.


![Gender Equality and Women's Empowerment in India [OD57]](/cache/preview/0/7/f/d/9/7/1/6/thumb-07fd97166dd92c7359501888c42037d3.jpg)