Transcription of Classification of Analytical Techniques
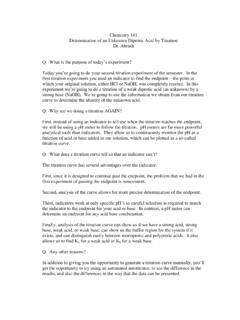
1 Introduction to Instrumental AnalysisClassification of Analytical TechniquesIntroductionIn quantitative chemical analysis, a sample is prepared and then analyzed to determine theconcentration of one (or more) of its components. The following figure gives a general overviewof this or instrumentalsingle- or multi-channelrelative or absoluteFigure 1: Schematic showing measurement steps involved in quantitative chemical analysis of asample. There are three ways of classifying the process, based on the technique (classical vsinstrumental), the measurement data (single-channel vs multi-channel), or on whether additionaldata is needed to estimate the analyte concentration (relative vs absolute).There are a very large number of Techniques used in chemical analysis. It can be very useful toclassify the measurement process according to a variety of criteria: by the type of Analytical technique classical or instrumental Techniques ; by the nature of the measurement data generated single-channel or multi-channeltechniques; and by the quantitation method (by which the analyte concentration is calculated) relative orabsolute 1In the next few sections, we will use these classifications to describe the characteristics of avariety of Analytical vs Instrumental TechniquesIn classical analysis, the signal depends on the chemical properties of the sample: a reagentreacts completely with the analyte, and the relationship between the measured signal and theanalyte concentration is determined by chemical stoichioimetry.
2 In instrumental analysis, somephysical property of the sample is measured, such as the electrical potential difference betweentwo electrodes immersed in a solution of the sample, or the ability of the sample to absorb methods are most useful for accurate and precise measurements of analyteconcentrations at the level or higher. On the other hand, some specialized instrumentaltechniques are capable of detecting individual atoms or molecules in a sample! Analysis at theppm ( g/mL) and even ppb (ng/mL) level is advantages of instrumental methods over classical methods include:1. The ability to perform trace analysis, as we have Generally, large numbers of samples may be analyzed very Many instrumental methods can be Most instrumental methods are multi-channel Techniques (we will discuss these shortly).5. Less skill and training is usually required to perform instrumental analysis than of these advantages, instrumental methods of analysis have revolutionized the field ofanalytical chemistry, as well as many other scientific fields.
3 However, they have not entirelysupplanted classical Analytical methods, due to the fact that the latter are generally more accurateand precise, and more suitable for the analysis of the major constituents of a chemical sample. Inaddition, the cost of many Analytical instruments can be quite analysis can be further classified according to the principles by which themeasurement signal is generated. A few of the methods are listed below. [The underlinedmethods are to be used in the round-robin experiments.] methods of analysis, in which the analyte participates in a redox reaction orother process. In potentiometric analysis, the analyte is part of a galvanic cell, whichgenerates a voltage due to a drive to thermodynamic equilibrium. The magnitude of thevoltage generated by the galvanic cell depends on the concentration of analyte in the samplesolution. In voltammetric analysis, the analyte is part of an electrolytic cell. Current flowswhen voltage is applied to the cell due to the participation of the analyte in a redox reaction;the conditions of the electrolytic cell are such that the magnitude of the current is directlyproportional to the concentration of analyte in the sample methods of analysis, in which the analyte interacts with electromagneticradiation.
4 Most of the methods in this category are based on the measurement of the amountof light absorbed by a sample; such absorption-based Techniques include atomic absorption,molecular absorption, and nmr methods. The rest of the methods are generally based on themeasurement of light emitted or scattered by a sample; these emission-based techniquesinclude atomic emission, molecular fluorescence, and Raman scatter The technique of mass spectroscopy is a powerful method for analysis in which the analyte isionized and subsequently detected. Although in common usage, the term spectroscopy isnot really appropriate to describe this method, since electromagnetic radiation is not usuallyinvolved in mass spectroscopy. Perhaps the most important use of mass spectrometers inquantitative analysis is as a gas or liquid chromatographic detector. A more recent innovationis the use of an inductively coupled plasma (ICP) as an ion source for a mass spectrometer;this combination (ICP-MS) is a powerful tool for elemental they do not actually generate a signal in and of themselves, some of the moresophisticated separation Techniques are usually considered instrumental methods.
5 Thesetechniques include chromatography and electrophoresis. These Techniques will separate achemical sample into its individual components, which are then typically detected by one of themethods listed , we should note that a number of methods that are based on stoichiometry, and so must beconsidered classical, still have a significant instrumental aspect to their nature. In particular,the Techniques of electrogravimetry, and potentiostatic and amperostatic coulometry arerelatively sophisticated classical methods that have a significant instrumental component. And letus not forget that instrumental methods can be used for endpoint detection in titrimetric though potentiostatic titrimetry uses an instrumental method of endpoint detection, it is stillconsidered a classical vs Multi-Channel TechniquesSo now we have classified Analytical methods according to the method by which they generatethe measurement data. Another useful distinction between Analytical Techniques is based on theinformation content of the data generated by the analysis: single-channel Techniques will generate but a single number for each analysis of the include gravimetric and potentiometric analysis.
6 In the former, the signal is a singlemass measurement ( , mass of the precipitate) and in the latter method the signal is a singlevoltage value. multi-channel Techniques will generate a series of numbers for a single analysis. Multi-channeltechniques are characterized by the ability to obtain measurements while changing someindependently controllable parameter. For example, in a molecular absorption method, anabsorption spectrum may be generated, in which the absorbance of a sample is monitored as afunction of the wavelength of the light transmitted through the sample. Measurement of thesample thus produces a series of absorbance 3 Any multi-channel technique can thus produce a plot of some type when analyzing a singlesample, where the signal is observed as a function of some other variable: absorbance as afunction of wavelength (in molecular absorbance spectroscopy), electrode potential as a functionof added titrant volume (potentiometric titrimetry), diffusion current as a function of appliedpotential (voltammetry), etc.
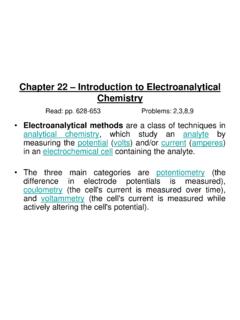
7 Multi-channel methods provide a lot more data and information than single-channel methods have two important advantages over their single-channel counterparts:1. They provide the ability to perform multicomponent analysis. In other words, theconcentrations of more than one analyte in a single sample may be Multi-channel methods can detect, and sometimes correct for, the presence of a number oftypes of interferences in the sample. If uncorrected, the presence of the interference willresult in biased estimates of analyte measurements simply give more information than a single-channel signal. Forexample, imagine that measurement of one of the calibration standards gives the data pictured infig 2(a):Independent variableCalibration StandardMeasured signalSampleIndependent variableMeasured signal(A)(B)Figure 2: illustration of how multi-channel data allow for the detection of of the multi-channel signal of the (a) the calibration standard, and (b) the samplereveals that there is interference in the latter.
8 A likely explanation is that another component of thesample (absent from the calibration standard) also gives a measurable response. The left side of thepeak appears relatively unaffected by the presence of the interferent; it may be possible to obtainan unbiased estimate of analyte concentration by using one of these channels for of the measurements of the other calibration standards (assuming they are notcontaminated) should give the same general shape, although the magnitude of the signal will ofcourse depend on the analyte imagine that you obtain multi-channel measurements of a sample, recording the followingdata shown in fig 2(b). It is immediately obvious that the shape has changed due to someinterference. A likely explanation is that some component of the sample matrix is alsocontributing to the measured signal, so that the result is the sum of the two (or perhaps more thantwo) sample components. Another possibility is that the sample matrix alters the response of theanalyte, giving rise to an altered peak 4 More than just identifying the presence of an interfering substance, multi-channel data oftenallows the analyst to correct for its presence.
9 For example, if it is suspected that the altered peakin fig 2(b) is due to an additional component, then a channel can be chosen for quantitationwhere the interfering substance does not contribute. The left side of the peak looks unaltered, soperhaps the data in one of these channels can be used to estimate analyte important point: although multi-channel methods are capable of collecting measurements onmultiple channels ( , different wavelengths), it is possible to use them in single-channel mode. In other words, to decrease measurement time, the analyst has the option of measuring theresponse on only a single channel ( , the wavelength corresponding to the peak response). Ifthe nature of the sample or standard is well known, this may be perfectly acceptable. However,the analyst must realize that a lot of information is being thrown away the advantages ofmulti-channel data described above (multicomponent analysis and detection/correction ofinterferences) will be lost.
10 As a general guideline, it is always a good idea to collect themulti-channel response of at least one of the calibration standards to see what the analyteresponse looks like, and then to collect the multi-channel response of at least one of the samplesto ensure that no interferences are last item: there is another way of classifying Analytical Techniques according to themeasurement data produced. Rather than single- and multi-channel Techniques , we may speak ofthe order of the Analytical technique . The order is equal to the number of independent parametersthat are controlled as the data is collected for each sample. Thus, single-channel techniqueswould be zeroth order methods, since only a single data point is collected. If absorbance ismeasured as a function of wavelength, as in molecular absorption spectroscopy, the technique islabelled first order. Examples of second order Techniques include the following: gas chromatography with mass spectrometric detection (the two independent parameters areretention time and ion mass /charge ratio); liquid chromatography with uv/vis spectrophotometric detection (signal is determined as afunction of retention time and wavelength); and molecular fluorescence (signal measured as a function of both excitation wavelength andemission wavelength).