Transcription of Climate and Weather - Portfolio manager
1 Page 1 Technical Reference Climate and Weather OVERVIEW The Climate of the area where your property is located and the annual fluctuations you experience in Weather conditions can affect how much energy you need to operate your buildings. Portfolio manager includes metrics designed to incorporate these effects and help you understand your energy performance. These procedures rely on temperature data collected by Weather monitoring stations and published by the National Climatic Data Center (NCDC), which is part of the National Oceanic and Atmospheric Administration (NOAA). To discuss how we use this data, it is helpful to introduce two concepts: Climate . Refers to regional variations in average Weather conditions.
2 For example, Florida has a warmer Climate than Maine. Weather . Refers to annual variations at a single location over time. For example, this year we had a very hot summer. In Portfolio manager , there are two key metrics that account for these effects: Weather Normalized Energy. Weather normalized energy is the energy your building would have used under average conditions (also referred to as Climate normals). The Weather in a given year may be much hotter or colder than your building s normal Climate ; Weather normalized energy accounts for this difference. Note that the adjustment is for Weather only, but not Climate . That is, the metric evaluates your building over time, but does not account for differences between your building and other locations that have different average (normal) climates. Weather normalized energy is not available for new building design projects because they have not yet experienced years with different Weather .
3 ENERGY STAR Score. The 1 - 100 ENERGY STAR score is a percentile ranking, which compares your building to its peers. The ENERGY STAR score accounts for both Climate and Weather . To provide a score, a regression equation is used to predict the energy your building is expected to use given its Climate , Weather , and business activity. Buildings that use less energy than this prediction score better and vice versa. The regression equation used for your prediction is based on a national analysis that includes buildings in all locations with different climates. Because of this national representation, regression coefficients on terms like Cooling Degree Days (CDD) and Heating Degree Days (HDD) incorporate the differences among these climates. To predict energy for your building in any given year, we will incorporate your actual experienced Weather data for that year.
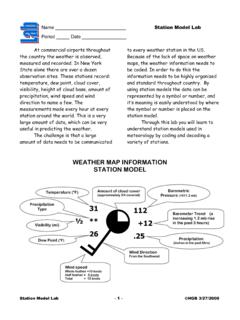
4 Your building is predicted to use more energy in a very hot year, for example. In the case of a new building design, the ENERGY STAR score will use the average normal Climate conditions to compute the energy prediction, as no actual Weather has been experienced. This document explains where we obtain Weather and Climate data and how we incorporate it into metrics: GETTING Climate AND Weather DATA ..2 Weather NORMALIZED ENERGY ..4 ENERGY STAR SCORE ..9 August 2019 Climate and Weather Effects August 2019 Climate and Weather Page 2 Technical Reference GETTING Climate AND Weather DATA Portfolio manager uses two main types of data: Daily Weather Data and Average (Normal) Climate Data. The appropriate Weather and Climate data is selected for your buildings by using the latitude and longitude of your postal code. Daily Weather Data EPA obtains daily Weather data for stations all around the world using the Global Surface Summary of the Day (GSOD) This dataset provides daily temperature, precipitation, air pressure and wind speed observed for Weather stations around the world.
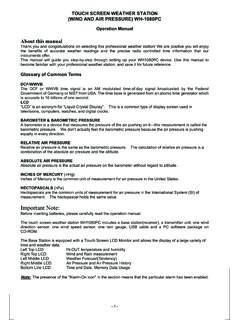
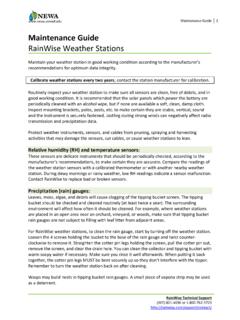
5 This data is used to compute key Weather metrics used in Portfolio manager , including the actual average monthly temperature, Heating Degree Days (HDD), and Cooling Degree Days (CDD).2 The GSOD set includes thousands of Weather stations. In order to determine which stations to use, EPA went through a rigorous process to identify stations with complete data going back to at least the year Based on this analysis, there are 774 stations used for the United States, 433 stations used for Canada, and 2,154 stations used for other countries around the world. Figures 1 and 2 illustrate the locations of these stations, demonstrating the diverse coverage of Weather data offered in Portfolio manager . Figure 1 Weather Stations in the and Canada 1 To access the GSOD data from NOAA s ftp site, visit: 2 HDD and CDD measure the deviation from a temperature of 65 degrees Fahrenheit over the course of the year.
6 For each day with an average temperature lower than 65 degrees, HDD is the difference between the average temperature and 65 degrees. The annual HDD is the sum of this difference across all days with an average temperature below 65 degrees. CDD is calculated in a similar manner, to measure deviations above 65 degrees. Note that 65oF is equivalent to 18oC. 3 The comprehensive review of GSOD data resulted in updates to Weather stations in Portfolio manager in July 2013. Annual review of Weather stations is conducted to ensure continued data availability. In cases where stations no longer meet EPA s data availability requirements, an alternative station is assigned. Qualifying stations were most recently updated in August 2019. August 2019 Climate and Weather Page 3 Technical Reference Figure 2 All Weather Stations in Portfolio manager Occasionally an individual station may be missing one or more days of data.
7 When data is missing, EPA will fill in gaps by averaging the preceding and following days together. This process of averaging values together is consistent with how NCDC fills in gaps for their own datasets and analyses. In the case that an entire month is missing, EPA will use the Climate normal value to fill in that month. If a Weather station stops reporting data for a period of several months, then EPA will remove that station from our list and use a replacement station with accurate data. NCDC updates the GSOD data on a regular basis as better information becomes available. To make sure data in Portfolio manager is up-to-date, EPA reviews data regularly and will update historical data on an annual basis to accommodate any modifications and corrections from NCDC. Average (Normal) Climate Data The term Climate normals is used to refer to average conditions within a certain Climate region.
8 Whereas daily Weather data sets report actual measurements taken at individual stations, Climate normal datasets are compiled based on a rigorous analysis of average trends. These datasets are generally reviewed and updated every 10 years. Because of these detailed procedures there are fewer sources of data, and many sources are country-specific. Portfolio manager accesses three different sets of data for Climate normals: United States. NCDC maintains a dataset of Climate normals that is updated every 10 years. The most recent set expresses the average conditions experienced between 1981 and 2010 ( ). Canada. Environment Canada maintains Climate normals and updates this data over time. The most recent set expresses the average conditions experienced between 1981 and 2010. ( ). Other Countries. The World Meteorological Organization publishes Climate normals for other countries.
9 However, this data does not include HDD and CDD, nor the daily data necessary to derive these fields. For this reason, it is not acceptable for Portfolio manager . In its place EPA has computed 10-year Climate normals from the GSOD daily data, using the average of reported data from 2001-2010. August 2019 Climate and Weather Page 4 Technical Reference Assigning a Weather station to Your Property In order to provide performance metrics to your specific building, we need to know which daily Weather station and which Climate normal to use:4 United States. We use the latitude/longitude coordinates of the daily Weather stations and the Zip Codes to determine which Weather station is closest to each Zip code. This Weather station is assigned to any properties located in that Zip code. In addition, based on the experience of ENERGY STAR partners benchmarking in coastal and mountainous regions with unique Weather patterns, we have performed an additional manual review of some Zip codes to identify areas where the closest station may not provide a good representation of the Weather .
10 Fewer than of Zip codes in the are mapped to a Weather station other than the closest station . Canada. Geographic regions in Canada are identified by the six-digit postal code. The latitude/longitude of these postal code regions and the Canadian Weather stations are used to determine which Weather station is closest to each region. Through this process, the same Weather station is assigned to all properties that have the same first three digits in their postal code. Other Countries. For other countries, Portfolio manager does not include an up-to-date inventory of postal codes. When you are entering your property, you are able to select your own Weather stations for use. A map is provided to help you identify the closest station , which you can then choose from a dropdown list. Weather NORMALIZED ENERGY Weather normalized energy is a means of adjusting for Weather and should be used to compare a building to itself over time.