Transcription of Coastal Flood Studies - ncfloodmaps.com
1 Coastal Flood Studies The State of North Carolina, through the Federal Emergency Management Agency s (FEMA s) Cooperating Technical Partnership initiative, has assumed primary ownership of and responsibility for the Flood Insurance Rate Maps (FIRMs) for all North Carolina Communities as part of the National Flood Insurance Program (NFIP). These maps show the extent of the 1% annual chance floodplain, also known as the Special Flood Hazard Area (SFHA). Floodplain management regulations apply within the SFHA, and Flood insurance is required for all property in the SFHA used to secure federally backed loans. Along rivers, streams, and lakes, Flood elevations are computed and used to delineate the extent of SFHAs.
2 These elevations are a function of the amount of water expected to drain into particular water body as a result of precipitation and runoff. In Coastal areas, however, the primary contributor to Flood elevations is the phenomenon known as storm surge . Furthermore, wave action contributes significantly to Coastal Flood elevations. The purpose of this fact sheet is to provide information on the different components of Coastal Flood elevations and explain how Coastal SFHAs and Flood zones are mapped on the FIRM. For information on Flood insurance for property located in Coastal SFHAs, please refer to the Flood Insurance Facts for Coastal Homeowners fact sheet.
3 How are Coastal Flood elevations determined? Along a coastline, major floods are caused by Coastal storms, usually hurricanes and northeasters. These types of storms bring very strong winds and waves that combine to pile water up against the shore and cause damage to both manmade and natural Coastal features. An engineering study, often referred to as a Coastal Flood study, analyzes the effects of a direct or near-direct hit on a Coastal community by a hurricane to determine Flood elevations and delineate SFHAs. The study also identifies Coastal high hazard areas within the SFHAs that are at the highest risk of damage caused by the combined effects of flooding and high wave action.
4 How is a Coastal Flood study performed? A Coastal Flood study considers four separate effects of a Coastal storm which, when added together, determine the Coastal Flood elevations for a particular location along the shoreline and further inland. Stillwater Elevation Long before a hurricane or northeaster makes landfall, the combined effect of circulating winds and large drop in air pressure causes a rise in sea level that creates a dome of water a few feet high in the vicinity of the storm. When it reaches the shoreline, the shallower seafloor forces the dome of water to rise dramatically, reaching heights of 10 to 20 feet above sea level. As it moves onshore, this storm surge is the largest component of Coastal flooding.
5 When considered separately from wave effects, its elevation is referred to as the stillwater elevation. Wave Setup As waves from a Coastal storm batter a coastline for several hours, they tend to pump up the water surface higher than the stillwater elevation. This effect is referred to as wave setup. Wave Crest Elevation Waves driven by hurricane-force winds ride atop the storm surge plus wave setup and alternately increase and decrease the water surface elevation. The wave crest elevation is the additional height that water reaches above the combined stillwater elevation plus wave setup height as a Coastal storm moves onshore. Wave Runup When waves hit the shoreline, the water is moving with such momentum that it is forced upward as it moves inland, particularly where there are steep bluffs, dunes, or man-made structures.
6 The additional height beyond the stillwater elevation reached by waves is called wave runup. March 2004 Page 1 of 4 How are these effects analyzed to determine Coastal Flood elevations? The methods used to analyze Coastal storm effects are established by FEMA. Three computer programs are used to simulate the impact of a Coastal storm on a section of coastline. The FEMA Coastal Storm Surge Model is used to determine the elevations for the 10% (10-year), 2% (50-year), 1% (100-year), and (500-year) annual chance stillwater elevations. The second FEMA computer program, Wave Height Analysis for Flood Insurance Studies (WHAFIS), accounts for erosion and provides the maximum expected wave crest elevation that must be added to the stillwater elevation plus wave setup.
7 Wave setup is determined using engineering equations derived by the Army Corps of Engineers. These equations take into account the offshore wave conditions and the slope of the beach and seafloor. On coastlines where wave runup must be considered, it is computed using the FEMA Runup Model computer program. Using these methods, Coastal engineers calculate storm surge and wave heights along a series of transects that represent the path of a Coastal storm as it moves onshore. How is the information from the computer simulations used to draw the Flood Insurance Rate Map? From the stillwater elevation and wave height data computed along the transects, Coastal engineers can use topographic map data to interpolate Flood elevations between the transects.
8 The engineers transfer this information to a base map that shows features of the community: shorelines, roads, municipal boundaries, etc. New Flood maps use an aerial photograph as a base map. The figure below is a schematic view showing the stillwater elevation and the increased water surface elevation caused by wave effects along a transect. The combination of the 1% annual chance stillwater and wave effect (crest, setup, and runup) water elevation above the vertical datum is the Base Flood Elevation, or BFE, that will be shown on the Flood Insurance Rate Map. For more information about the vertical datum, please refer to the Vertical Datum Changes fact sheet which explains the difference between the National Geodetic Vertical Datum of 1929 (NGVD 29) historically used on FIRMs, and the North American Vertical Datum of 1988 (NAVD 88) used on recently updated FIRMs.
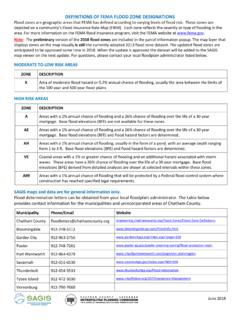
9 AE ZONE VE ZONE VE ZONE Page 2 of 4 Rev. 5 March 2004 Page 3 of 4 March 2004 Engineers depict Flood hazard data on the map by drawing outlines of the Flood risk zones. The SFHAs (areas where the there is a 1% or greater annual chance of flooding) are identified as AE Zones or VE Zones. Areas where there is a lower (between and 1% annual chance) risk of flooding are identified as Shaded X Zones. Areas where there is a minimal risk of flooding (less than annual chance) are identified as Unshaded X Zones. The Coastal AE and VE zones are further subdivided by lines that separate areas with different BFEs. Within each of these areas, the risk zone (AE or VE) and the BFE are identified.
10 For instance, ZONE VE (EL 14) on the FIRM indicates that the area is in the VE risk zone and the BFE is 14 feet above mean seal level. A Coastal AE Zone with a BFE of 12 feet is designated on the FIRM as ZONE AE (EL 12). What is the difference between an AE Zone and a VE Zone? One output of the aforementioned WHAFIS computer model is the distance inland from the shoreline where wave heights are greater than three feet during the 1% annual chance storm. This distance defines the boundary of the Coastal high hazard area where the combined risk of Flood and wave damage is highest. These areas are designated as VE Zones. The V stands for velocity wave action , indicating that waves in these areas will be powerful enough to break the wall panel of a residential structure away from the floor to which it has been nailed.