Transcription of Comparison of Electricity Prices in Major North American ...
1 0,0272 Comparison OF Electricity Prices IN Major North American CITIESR ates in effect April 1, 20161 TABLE OF CONTENTSINTRODUCTION 3 METHOD 7 HIGHLIGHTS 9 Residential Customers 9 Small-Power Customers 10 Medium-Power Customers 11 Large-Power Customers 14 DETAILED RESULTS1 Summary Tables (excluding taxes) 172 Summary Tables (including taxes)
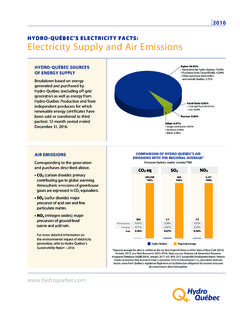
2 233 Detailed Tables Residential 294 Detailed Tables Small Power 355 Detailed Tables Medium Power 416 Detailed Tables Large Power 47 APPENDICESA Rate Adjustments 53B Time-of-Use Rates Adjustment Clauses 57C Applicable Taxes 63D Utilities in the Study 713 INTRODUCTIONE very year, Hydro-Qu bec compares the monthly Electricity bills of Qu bec customers in the residential, commercial, institutional and industrial sectors with those of customers of the various utilities serving 21 Major North American report details the principal conclusions of this comparative analysis of Prices in effect on April 1, 2016. There are three sections. The first describes the method used to estimate Electricity bills. The second examines the highlights of the seven consumption levels analyzed, with the help of charts. Finally, the third section presents the results of the 21 consumption levels for which data were collected and compiled in the form of summary and detailed tables.
3 The most recent rate adjustments, time-of-use rates, adjustment clauses and applicable taxes, as well as a profile of the utilities in the study, appear in separate North American CITIESAVERAGE Prices FOR RESIDENTIAL CUSTOMERS 1 (IN /K W H)21) For a monthly consumption of 1,000 k W h; rates in effect April 1, ) In Canadian John s, N L: Edmonton, A B: Vancouver, B C: , P E: Calgary, A B: , N B: Seattle, W A: Regina, S K: , N S: Winnipeg, M B: Portland, O R: Montr al, Q C: , O N: Toronto, O N: Boston, M A: Detroit, M I: New York, N Y: , I L: San Francisco, C A: Nashville, T N: , T X: Miami, F L: Privy Council border (not final)5 Major North American CITIESAVERAGE Prices FOR LARGE-POWER CUSTOMERS 1 (IN /K W H)21) For a monthly consumption of 3,060,000 k W h and a power demand of 5,000 kW; rates in effect April 1, ) In Canadian currency. St. John s, N L: Edmonton, A B: Vancouver, B C: , P E: Calgary, A B: , N B: Seattle, W A: Regina, S K: , N S: Winnipeg, M B: Portland, O R: , O N: Montr al, Q C: , O N: Boston, M A: Detroit, M I: New York, N Y: , I L: San Francisco, C A: Nashville, T N: , T X: Miami, F L: Privy Council border (not final)7 METHODIn addition to Hydro-Qu bec, this comparative analysis of Electricity Prices across North America includes 22 utilities: 12 serving the principal cities in the nine other Canadian provinces, and 10 utilities in American states.
4 The results are based, in part, on a survey to which 12 utilities responded, and in part on estimates of bills calculated by Hydro-Qu bec and confirmed in most cases by the utilities results presented here show the total bill for various consumption levels. If the bill is calculated according to an unbundled rate, it includes all components, including supply, transmission and COVERED Monthly bills have been calculated based on rates in effect on April 1, 2016. The most recent rate adjustments applied by the utilities in the study between April 1, 2015, and April 1, 2016, are shown in Appendix LEVELS Seven consumption levels were selected for analysis . However, data were collected for 21 consumption levels and those results are presented in the Detailed the exception of the bills presented in Section 2, taxes are not included in any of the calculations. Appendix C lists taxes applicable on April 1, 2016, by customer category; those which may be partially or fully refundable are also PROGRAMSThe bills have been calculated according to base rates.
5 Optional rates or programs offered by some utilities to their residential, commercial, institutional or industrial customers have not been taken into account since the terms and conditions vary considerably from one utility to the LOCATIONE lectricity distributors sometimes offer different rates in the various cities they serve. As well, taxes may vary from one region to another. This, however, is not the case in Qu bec, where, with the exception of territories North of the 53rd parallel, taxes and rates are applied uniformly. For the purposes of this study, the bill calculations estimate as closely as possible the actual Electricity bills of consumers in each target city, based on rates in effect on April 1, RATESThe rates offered by some utilities vary depending on the season and/or time of day when energy is consumed. In the United States, for example, a number of utilities set a higher price in summer, when demand for air-conditioning is stronger.
6 In Qu bec, on the other hand, demand increases in winter because of heating requirements. Thus, for some utilities, April 1 may fall within a period in the year when the price is high, whereas for others it falls in a period when the price is low. An annual average price has therefore been calculated in the case of utilities with time-of-use rates which are listed in Appendix CLAUSESThe rates of some distributors include adjustment clauses that allow them to adjust their customers Electricity bills according to changes in different variables. Since these adjustments may be applied monthly, or over a longer period, the Electricity bills issued by a given distributor may have varied between April 1, 2015, and April 1, 2016, even though base rates remained the same. Appendix B lists the adjustment clauses taken into account when calculating RATEThe exchange rate used to convert bills in dollars into Canadian dollars is $ (C A $ 1 = U S $ ), the rate in effect at noon on April 1, 2016.
7 The Canadian dollar had thus depreciated by relative to the dollar on April 1, Electricity Rates effective April 1, 2016 sets out Hydro-Qu bec s rates, as approved by the R gie de l nergie (the Qu bec energy board) in accordance with Decision D-2016-047. Three types of rates are in effect: domestic rates, for residential customers, the industrial rate, for large-power industrial customers, and general rates, for other customers. General rates are applied according to minimum billing demand: small power, medium power and large power. For Comparison purposes, the Electricity bills of the utilities in the study have been analyzed according to these customer categories. The industrial rate has been used to calculate the bills of large-power CUSTOMERSThe rate applicable to Hydro-Qu bec s residential customers is among the most advantageous in North America. For customers whose monthly consumption is 1,000 k W h, Montr al is once again in first place.
8 Figure 1 illustrates the results of this bec = 100 Monthly bill (excluding tax)Rates in effect April 1, 2016 FIGURE 1100117143144148156161166173188193203210 2202222242462803834094300100200300400500 Montr al, QCWinnipeg, MBEdmonton, ABCalgary, ABVancouver, BCHouston, TXMiami, FLSt. John s, NLMoncton, NBSeattle, WAPortland, ORNashville, TNRegina, SKChicago, ILHalifax, NSCharlottetown, PEOttawa, ONToronto, ONDetroit, MIBoston, MANew York, NYSan Francisco, CANew York, NYSan Francisco, CABoston, MADetroit, MIHalifax, NSCharlottetown, PERegina, SKToronto, ONOttawa, ONCalgary, ABHouston, TXNashville, TNMoncton, NBPortland, OREdmonton, ABChicago, ILSt. John s, NLMiami, FLSeattle, WAVancouver, BCWinnipeg, MBMontr al, Qc198 comparative Index of Electricity PricesResidential Customers Consumption: 1,000 kWh/month10 SMALL-POWER CUSTOMERS (LESS THAN 100 K W)The Comparison of bills for small-power customers is based on a monthly consumption of 10,000 k W h and a power demand of 40 k W.
9 Montr al holds third place followed closely by Edmonton. Figure 2 shows the comparative index of Electricity Prices . Hydro-Qu bec = 100 Monthly bill (excluding tax)Rates in effect April 1, 2016 FIGURE 20 Calgary, ABWinnipeg, MBMontr al, QCEdmonton, ABHouston, TXSt. John s, NLSeattle, WAVancouver, BCMiami, FLRegina, SKChicago, ILMoncton, NBPortland, ORDetroit, MINashville, TNHalifax, NSOttawa, ONCharlottetown, PEToronto, ONSan Francisco, CANew York, NYBoston, MA83841001001091121131141211261301341381 5215415516017017727728329050100150200250 300350 comparative Index of Electricity PricesSmall-Power CustomersConsumption: 10,000 kWh/month Power demand: 40 kW11 MEDIUM-POWER CUSTOMERS (100 TO 5,000 K W)Three consumption levels were analyzed for medium-power customers. In all three cases, the bills of Hydro-Qu bec s customers have remained below the average of the other Major North American cities. Figures 3, 4 and 5 show the comparative index of Electricity Prices for these consumption profiles.
10 For medium-power customers with a monthly consumption of 100,000 k W h and a power demand of 500 k W, Montr al is in seventh place, whereas it held sixth place last year. Hydro-Qu bec = 100 Monthly bill (excluding tax)Rates in effect April 1, 2016 FIGURE 3050100150200250300 Calgary, ABWinnipeg, MBSeattle, WAVancouver, BCSt. John s, NLChicago, ILMontr al, QCHouston, TXMiami, FLEdmonton, ABPortland, ORMoncton, NBRegina, SKDetroit, MIOttawa, ONHalifax, NSNashville, TNCharlottetown, PEToronto, ONBoston, MANew York, NYSan Francisco, CA96100102112117118118121123127141142147 1482292572727486949876 comparative Index of Electricity PricesMedium-Power CustomersConsumption: 100,000 kWh/monthPower demand: 500 kW12 For customers with a monthly consumption of 400,000 k W h and a power demand of 1,000 k W, Montr al is in third place, as was the case last bec = 100 Monthly bill (excluding tax)Rates in effect April 1, 2016 FIGURE 4798010010210711111911911912513213313514 61601671802790157 Calgary, ABWinnipeg, MBMontr al, QCChicago, ILVancouver, BCSt.