Transcription of Consolidated statement of comprehensive income
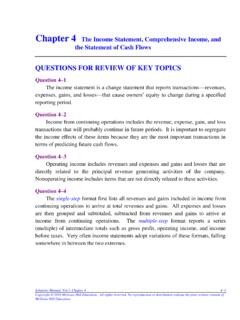
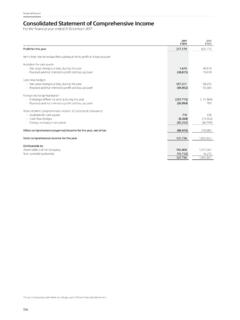
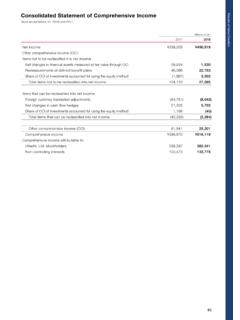
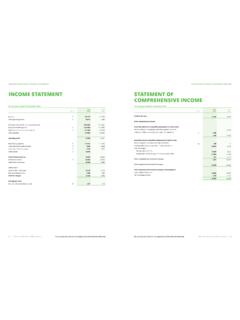
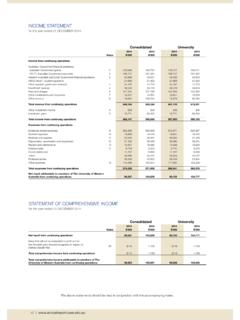
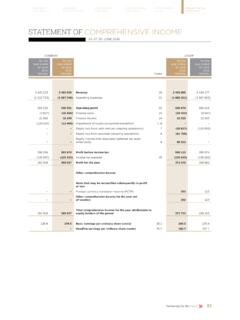
1 Consolidated statement of comprehensive income FOR THE YEAR ENDED 31 DECEMBER 2017 2017 2016 NOTE US$M US$M Gross written premium 14,191 14,395 Unearned premium movement 255 (119) Gross earned premium revenue 14,446 14,276 Outward reinsurance premium (2,615) (2,653) Deferred reinsurance premium movement 210 (557) Outward reinsurance premium expense (2,405) (3,210) Net earned premium (a) 12,041 11,066 Gross claims expense (11,418) (9,042) Reinsurance and other recoveries revenue 2,881 2,600 Net claims expense (b) (8,537) (6,442) Gross commission expense (2,482) (2,425) Reinsurance commission revenue 366 391 Net commission (c) (2,116) (2,034) Underwriting and other expenses (d) (1,961) (1,922) Underwriting result (a)+(b)+(c)+(d) (573) 668 Investment and other income policyholders' funds 488 422 Investment expenses policyholders' funds (13) (15) Insurance (loss) profit (98) 1,075 Investment and other income shareholders' funds 345 348 Investment expenses shareholders' funds (8) (9) Financing and other costs (305) (294) Losses on sale of entities (6) Unrealised losses on assets held for sale (3) Share of net losses of associates (1) Amortisation and impairment of intangibles (752) (45) (Loss) profit before income tax (825) 1,072 income tax expense (428) (228) (Loss) profit after income tax (1,253) 844 Other comprehensive (loss) income Items that may be reclassified to profit or loss Net movement in foreign currency translation reserve (90) (474) Net movement in cash flow hedges (1)
2 Share of net other comprehensive loss of associates (1) income tax relating to these components of other comprehensive income (20) 33 Items that will not be reclassified to profit or loss Gains (losses) on remeasurement of defined benefit superannuation plans 16 (48) Losses on revaluation of owner occupied property (1) income tax relating to these components of other comprehensive income (22) 10 Other comprehensive loss after income tax (118) (480) Total comprehensive (loss) profit after income tax (1,371) 364 (Loss) profit after income tax attributable to: Ordinary equity holders of the company (1,249) 844 Non-controlling interests (4) (1,253) 844 Total comprehensive (loss) income after income tax attributable to: Ordinary equity holders of the company (1,367) 364 Non-controlling interests (4) (1,371) 364 (LOSS) EARNINGS PER SHARE FOR (LOSS) PROFIT AFTER income TAX ATTRIBUTABLE TO ORDINARY EQUITY HOLDERS OF THE COMPANY 2017 2016 NOTE US CENTS US CENTS Basic (loss) earnings per share ( ) Diluted (loss) earnings per share ( ) The Consolidated statement of comprehensive income should be read in conjunction with the accompanying notes.
3 92 Consolidated statement of comprehensive income FOR THE YEAR ENDED 31 DECEMBER 2017 2017 2016 NOTE US$M US$M Gross written premium 14,191 14,395 Unearned premium movement 255 (119) Gross earned premium revenue 14,446 14,276 Outward reinsurance premium (2,615) (2,653) Deferred reinsurance premium movement 210 (557) Outward reinsurance premium expense (2,405) (3,210) Net earned premium (a) 12,041 11,066 Gross claims expense (11,418) (9,042) Reinsurance and other recoveries revenue 2,881 2,600 Net claims expense (b) (8,537) (6,442) Gross commission expense (2,482) (2,425) Reinsurance commission revenue 366 391 Net commission (c) (2,116) (2,034) Underwriting and other expenses (d) (1,961) (1,922) Underwriting result (a)+(b)+(c)+(d) (573) 668 Investment and other income policyholders' funds 488 422 Investment expenses policyholders' funds (13) (15) Insurance (loss) profit (98) 1,075 Investment and other income shareholders' funds 345 348 Investment expenses shareholders' funds (8) (9) Financing and other costs (305) (294) Losses on sale of entities (6) Unrealised losses on assets held for sale (3) Share of net losses of associates (1) Amortisation and impairment of intangibles (752) (45) (Loss) profit before income tax (825) 1,072 income tax expense (428) (228) (Loss) profit after income tax (1,253) 844 Other comprehensive (loss) income Items that may be reclassified to profit or loss Net movement in foreign currency translation reserve (90) (474) Net movement in cash flow hedges (1)
4 Share of net other comprehensive loss of associates (1) income tax relating to these components of other comprehensive income (20) 33 Items that will not be reclassified to profit or loss Gains (losses) on remeasurement of defined benefit superannuation plans 16 (48) Losses on revaluation of owner occupied property (1) income tax relating to these components of other comprehensive income (22) 10 Other comprehensive loss after income tax (118) (480) Total comprehensive (loss) profit after income tax (1,371) 364 (Loss) profit after income tax attributable to: Ordinary equity holders of the company (1,249) 844 Non-controlling interests (4) (1,253) 844 Total comprehensive (loss) income after income tax attributable to: Ordinary equity holders of the company (1,367) 364 Non-controlling interests (4) (1,371) 364 (LOSS) EARNINGS PER SHARE FOR (LOSS) PROFIT AFTER income TAX ATTRIBUTABLE TO ORDINARY EQUITY HOLDERS OF THE COMPANY 2017 2016 NOTE US CENTS US CENTS Basic (loss) earnings per share ( ) Diluted (loss) earnings per share ( ) The Consolidated statement of comprehensive income should be read in conjunction with the accompanying notes.
5 Consolidated balance sheet AS AT 31 DECEMBER 2017 2017 2016 NOTE US$M US$M Assets Cash and cash equivalents 572 847 Investments 25,554 24,374 Derivative financial instruments 223 151 Trade and other receivables 4,906 4,831 Current tax assets 22 51 Deferred insurance costs 2,257 1,965 Reinsurance and other recoveries on outstanding claims 6,311 4,540 Other assets 7 8 Assets held for sale 63 85 Defined benefit plan surpluses 33 27 Property, plant and equipment 276 257 Deferred tax assets 514 778 Investment properties 15 14 Investments in associates 30 28 Intangible assets 3,079 3,627 Total assets 43,862 41,583 Liabilities Derivative financial instruments 144 147 Trade and other payables 2,327 2,139 Current tax liabilities 160 73 Liabilities held for sale 28 72 Unearned premium 6,887 6,763 Outstanding claims 21,579 18,321 Provisions 104 69 Defined benefit plan deficits 60 85 Deferred tax liabilities 56 106 Borrowings 3,616 3,474 Total liabilities 34,961 31,249 Net assets 8,901 10,334 Equity Share capital 8,931 8,350 Treasury shares held in trust (50) Reserves (1,785) (1,654) Retained profits 1,763 3,588 Shareholders' funds 8,859 10,284 Non-controlling interests 42 50 Total equity 8,901 10,334 The Consolidated balance sheet should be read in conjunction with the accompanying notes.
6 Other information6 Financial Report5 Performance overview1 Business review2 Governance3 Directors' Report4 QBE Insurance Group Annual Report 201793 Consolidated statement of changes in equity FOR THE YEAR ENDED 31 DECEMBER 2017 2017 SHARE CAPITAL US$M TREASURY SHARES HELD IN TRUST US$M RESERVES US$M RETAINED PROFITS US$M SHARE-HOLDERS' FUNDS US$M NON-CONTROLLING INTERESTS US$M TOTAL EQUITY US$M As at 1 January 8,350 (1,654) 3,588 10,284 50 10,334 Loss after income tax (1,249) (1,249) (4) (1,253) Other comprehensive loss (112) (6) (118) (118) Total comprehensive loss (112) (1,255) (1,367) (4) (1,371) Transactions with owners in their capacity as owners Shares bought back on-market and cancelled (108) (108) (108) Shares acquired and held in trust (156) (156) (156) Share-based payment expense 39 39 39 Shares vested and/or released 108 (74) 34 34 Contributions of equity, net of transaction costs and tax 1 1 1 Dividends paid on ordinary shares (578) (578) (4) (582) Dividend reinvestment under Bonus Share Plan 8 8 8 Foreign exchange movement 688 (2) 16 702 702 As at 31 December 8,931 (50) (1,785) 1,763 8,859 42 8,901 2016 SHARE CAPITAL US$M TREASURY SHARES HELD IN TRUST US$M RESERVES US$M RETAINED PROFITS US$M SHARE-HOLDERS' FUNDS US$M NON-CONTROLLING INTERESTS US$M TOTAL EQUITY US$M As at 1 January 8,440 (1,248) 3,313 10,505 55 10,560 Profit after income tax 844 844 844 Other comprehensive loss (442) (38) (480) (480) Total comprehensive income (442)
7 806 364 364 Transactions with owners in their capacity as owners Shares acquired and held in trust (79) (79) (79) Share-based payment expense 58 58 58 Shares vested and/or released 79 (38) 41 41 Contributions of equity, net of transaction costs and tax 1 1 1 Net changes in non-controlling interests 25 25 (5) 20 Reclassification on disposal of owner occupied property (4) 4 Dividends paid on ordinary shares (537) (537) (537) Dividend reinvestment under Bonus Share Plan 2 2 2 Foreign exchange movement (91) (5) (96) (96) As at 31 December 8,350 (1,654) 3,588 10,284 50 10,334 The Consolidated statement of changes in equity should be read in conjunction with the accompanying notes. 94 Consolidated statement of changes in equity FOR THE YEAR ENDED 31 DECEMBER 2017 2017 SHARE CAPITAL US$M TREASURY SHARES HELD IN TRUST US$M RESERVES US$M RETAINED PROFITS US$M SHARE-HOLDERS' FUNDS US$M NON-CONTROLLING INTERESTS US$M TOTAL EQUITY US$M As at 1 January 8,350 (1,654) 3,588 10,284 50 10,334 Loss after income tax (1,249) (1,249) (4) (1,253) Other comprehensive loss (112) (6) (118) (118) Total comprehensive loss (112) (1,255) (1,367) (4) (1,371) Transactions with owners in their capacity as owners Shares bought back on-market and cancelled (108) (108) (108) Shares acquired and held in trust (156) (156) (156) Share-based payment expense 39 39 39 Shares vested and/or released 108 (74)
8 34 34 Contributions of equity, net of transaction costs and tax 1 1 1 Dividends paid on ordinary shares (578) (578) (4) (582) Dividend reinvestment under Bonus Share Plan 8 8 8 Foreign exchange movement 688 (2) 16 702 702 As at 31 December 8,931 (50) (1,785) 1,763 8,859 42 8,901 2016 SHARE CAPITAL US$M TREASURY SHARES HELD IN TRUST US$M RESERVES US$M RETAINED PROFITS US$M SHARE-HOLDERS' FUNDS US$M NON-CONTROLLING INTERESTS US$M TOTAL EQUITY US$M As at 1 January 8,440 (1,248) 3,313 10,505 55 10,560 Profit after income tax 844 844 844 Other comprehensive loss (442) (38) (480) (480) Total comprehensive income (442) 806 364 364 Transactions with owners in their capacity as owners Shares acquired and held in trust (79) (79) (79) Share-based payment expense 58 58 58 Shares vested and/or released 79 (38) 41 41 Contributions of equity, net of transaction costs and tax 1 1 1 Net changes in non-controlling interests 25 25 (5) 20 Reclassification on disposal of owner occupied property (4) 4 Dividends paid on ordinary shares (537) (537) (537) Dividend reinvestment under Bonus Share Plan 2 2 2 Foreign exchange movement (91) (5) (96) (96) As at 31 December 8,350 (1,654) 3,588 10,284 50 10,334 The Consolidated statement of changes in equity should be read in conjunction with the accompanying notes.
9 Consolidated statement of cash flows FOR THE YEAR ENDED 31 DECEMBER 2017 2017 2016 NOTE US$M US$M Operating activities Premium received 14,565 14,939 Reinsurance and other recoveries received 1,516 1,556 Outward reinsurance paid (2,575) (2,786) Claims paid (9,114) (9,018) Acquisition and other underwriting costs paid (4,190) (3,987) Interest received 487 450 Dividends received 91 65 Other operating payments (226) (184) Interest paid (290) (273) income taxes paid (92) (203) Net cash flows from operating activities 172 559 Investing activities Proceeds on sale of growth assets 2,855 3,258 Payments for purchase of growth assets (2,609) (2,755) Net payments for foreign exchange transactions (3) (101) Net proceeds on sale of interest bearing financial assets 198 35 Payments for purchase of intangible assets (87) (216) Net proceeds on sale of non-controlling interests 16 Proceeds on disposal of entities (net of cash disposed) 11 Proceeds on sale of investment property 1 Proceeds on sale of property, plant and equipment 2 14 Payments for purchase of property, plant and equipm