Transcription of Contrasts and Post Hoc Tests
1 Prof. Andy Field, 2016 Page 1 Contrasts and post Hoc Tests for One-Way Independent ANOVA Using SPSS Running the Analysis In last week s lecture we came across an example, from Field (2013), about the drug Viagra, which is a sexual stimulant (used to treat impotence), which is supposed to make men better lovers. Suppose we tested this belief by taking three groups of people and administering one group with a placebo (such as a sugar pill), one group with a low dose of Viagra and one with a high dose. The dependent variable was an objective measure of libido (I will tell you only that it was measured over the course of a week the rest I shall leave to your own imagination).
2 The data can be found below. Table 1: Data showing how libido differs after different doses of Viagra Dose Libido Placebo 3 2 1 1 4 Low Dose Viagra 5 2 4 2 3 High Dose Viagra 7 4 5 3 6 First, let s conduct an ANOVA on the Viagra data. As with the data from earlier in this lesson (rugby injuries) we need to enter the data into the data editor using a coding variable specifying to which of the three groups the score belongs. So, the data are entered in two columns (one called dose which specifies how much Viagra the person was given and one called libido which indicates the person s libido over the following week).
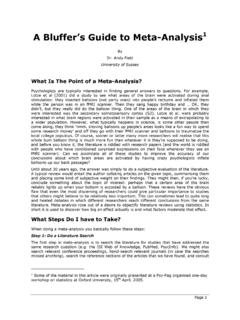
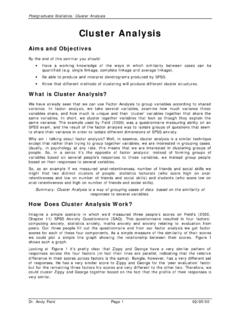
3 You can code the variable dose any way you wish but I recommend something simple such as 1 = placebo, 2 = low dose and 3 = high dose. Enter the data into SPSS. Save the data onto a disk in a file called Plot an error bar graph of the data. To conduct one-way ANOVA we have to first access the main dialogue box by selecting (Figure 1). This dialogue box has a space where you can list one or more dependent variables and a second space to specify a grouping variable, or factor. Factor is another term for independent variable.
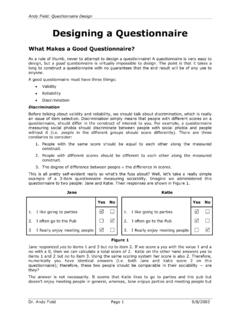
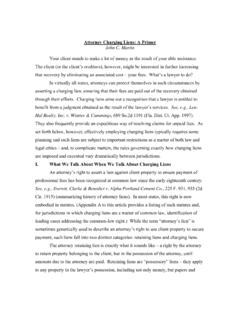
4 For the Viagra data we need select only libido from the variable list and drag it to the box labelled Dependent List (or click on click on ). Then select the grouping variable dose and transfer it to the box labelled Factor (or click on ). Prof. Andy Field, 2016 Page 2 Figure 1: Dialogue box for one-way ANOVA Planned Comparisons Using SPSS Click on to access the dialogue box that allows you to conduct planned comparisons. The dialogue box is shown in Figure 2 and has two sections. The first section is for specifying trend analyses.
5 If you want to test for trends in the data then tick the box labelled Polynomial and select the degree of polynomial you would like. The Viagra data has only three groups and so the highest degree of trend there can be is a quadratic trend (see Field, 2013 Chapter 11). It is important from the point of view of trend analysis that we have coded the grouping variable in a meaningful order. We expect libido to be smallest in the placebo group, to increase in the low dose group and then to increase again in the high dose group. To detect a meaningful trend, we need to have coded these groups in ascending order.
6 We have done this by coding the placebo group with the lowest value 1, the low dose group with the middle value 2, and the high dose group with the highest coding value of 3. If we coded the groups differently, this would influence both whether a trend is detected, and if by chance a trend is detected whether it is meaningful. For the Viagra data there are only three groups and so we should select the polynomial option (), and then select a quadratic degree by clicking on and then selecting Quadratic (the drop-down list should now say ).
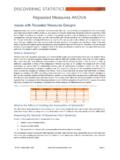
7 If a quadratic trend is selected SPSS will test for both linear and quadratic trends. Figure 2: Dialog box for conducting planned comparisons The lower part of the dialogue box in Figure 2 is for specifying planned comparisons. To conduct planned comparisons we need to tell SPSS what weightings to assign to each group. The first step is to decide which comparisons you want to do and then what weights must be assigned to each group for each of the Contrasts (see Field, 2013, Chapter 11). We saw in the lecture that a sensible set of Contrasts would be to compare the two experimental groups to the control group (Low dose + high dose vs.)
8 Placebo) as contrast 1, and then compare the low dose to the high dose in a second contrast . The weights for contrast 1 would be: 2 (placebo group), +1 (Low dose group), and +1 (high dose group). We will specify this contrast first. It is important to make sure that you enter the correct weighting for each group, so you should remember that the first weight that you enter should be the weight for the first group (that is, the group coded with the lowest value in the data editor). For the Viagra data, the group coded with the lowest value was the placebo Prof.
9 Andy Field, 2016 Page 3 group (which had a code of 1) and so we should enter the weighting for this group first. Click in the box labelled Coefficients with the mouse and then type 2 in this box and click on . Next, we input the weight for the second group, which for the Viagra data is the low dose group (because this group was coded in the data editor with the second highest value). Click in the box labelled Coefficients with the mouse and then type 1 in this box and click on . Finally, we need to input the weight for the last group, which for the Viagra data is the high dose group (because this group was coded with the highest value in the data editor).
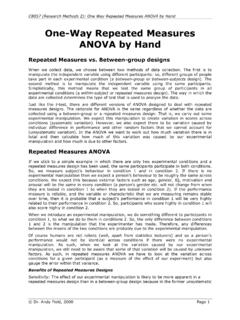
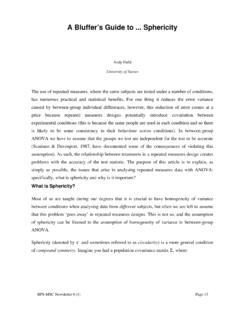
10 Click in the box labelled Coefficients with the mouse and then type 1 in this box and click on . The box should now look like Figure 3 (left). Figure 3: Contrasts dialog box completed for the two Contrasts of the Viagra data Once you have input the weightings you can change or remove any one of them by using the mouse to select the weight that you want to change. The weight will then appear in the box labelled Coefficients where you can type in a new weight and then click on . Alternatively, you can click on any of the weights and remove it completely by clicking.