Transcription of cluster - Discovering Statistics
1 Postgraduate Statistics : cluster Analysis cluster Analysis Aims and Objectives By the end of this seminar you should: have a working knowledge of the ways in which similarity between cases can be quantified ( single linkage, complete linkage and average linkage). Be able to produce and interpret dendrograms produced by SPSS. Know that different methods of clustering will produce different cluster structures. What is cluster Analysis? We have already seen that we can use Factor Analysis to group variables according to shared variance. In factor analysis, we take several variables, examine how much variance these variables share, and how much is unique and then cluster ' variables together that share the same variables.
2 In short, we cluster together variables that look as though they explain the same variance. The example used by Field (2000) was a questionnaire measuring ability on an SPSS exam, and the result of the factor analysis was to isolate groups of questions that seem to share their variance in order to isolate different dimensions of SPSS anxiety. Why am I talking about factor analysis? Well, in essence, cluster analysis is a similar technique except that rather than trying to group together variables, we are interested in grouping cases. Usually, in psychology at any rate, this means that we are interested in clustering groups of people.
3 So, in a sense it's the opposite of factor analysis: instead of forming groups of variables based on several people's responses to those variables, we instead group people based on their responses to several variables. So, as an example if we measured anal-retentiveness, number of friends and social skills we might find two distinct clusters of people: Statistics lecturers (who score high on anal- retentiveness and low on number of friends and social skills) and students (who score low on anal-retentiveness and high on number of friends and social skills). Summary: cluster Analysis is a way of grouping cases of data based on the similarity of responses to several variables.
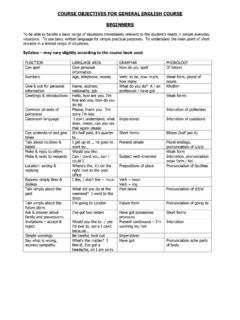
4 How Does cluster Analysis Work? Imagine a simple scenario in which we'd measured three people's scores on Field's (2000, Chapter 11) SPSS Anxiety Questionnaire (SAQ). This questionnaire resulted in four factors: computing anxiety, Statistics anxiety, maths anxiety and anxiety relating to evaluation from peers. Our three people fill out the questionnaire and from our factor analysis we get factor scores for each of these four components. As a simple measure of the similarity of their scores we could plot a simple line graph showing the relationship between their scores. Figure 1. shows such a graph. Looking at Figure 1 it's pretty clear that Zippy and George have a very similar pattern of responses across the four factors (in fact their lines are parallel, indicating that the relative difference in their scores across factors is the same).
5 Bungle, however, has a very different set of responses. He has a very similar score to Zippy and George for the peer evaluation' factor but for the remaining three factors his scores are very different to the other two. Therefore, we could cluster Zippy and George together based on the fact that the profile of their responses is very similar. Dr. Andy Field Page 1 02/05/00. Postgraduate Statistics : cluster Analysis 7. 6. 5. Zippy 4. George 3. Bungle 2. 1. 0. Comp Stats Maths Peer Figure 1. How is Similarity Measured? Obviously, looking at graphs of responses if a very subjective way to establish whether two people have similar responses across variables.
6 In addition, in situations in which we have hundreds of people and lots of variables, the graphs of responses that we plot would become very cumbersome and almost impossible to interpret. Therefore, we need some objective way to measure the degree of similarity between people's scores across a number of variables. There are two types of measure: similarity coefficients and dissimilarity coefficients. Can you think of a measure of similarity of two variables that you've come across before (numerous times) that could be adapted to measure the similarity of people? Correlation Coefficient, r We've already seen that the correlation coefficient is a measure of similarity between two variables (it tells us whether as one variable changes the other changes by a similar amount).
7 In theory, we could apply the correlation coefficient to two people rather than two variables to see whether the pattern of responses for one person is the same as the other. The correlation coefficient is a standardised measure and so it has the advantage that it is unaffected by dispersion differences across variables (in plain English this means that if the variables across which we're comparing people are measured in different units the correlation coefficient will not be affected). However, there is a problem with using a simple correlation coefficient to compare people across variables: it ignores information about the elevation of scores.
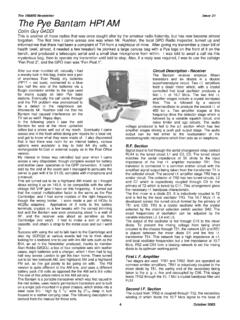
8 Therefore, although the correlation coefficient tells us whether the pattern of responses between people are similar, it doesn't tell us anything about the distance between two people's profiles. 7 7. 6 6. 5 5. 4 Zippy 4 Zippy 3 George 3 George 2 2. 1 1. 0 0. p p r r hs hs s s ee ee om om at at at at St St P. P. C. C. M. M. Figure 2. Dr. Andy Field Page 2 02/05/00. Postgraduate Statistics : cluster Analysis Figure 2 shows two examples of responses across the factors of the SAQ. In both diagrams the two people (Zippy and George) have similar profiles (the lines are parallel). Therefore, the resulting correlation coefficient for the two graphs would be identical (in fact, you'd get a perfect correlation of 1).
9 However, the distance between the two profiles is much greater in the second graph (the elevation is higher). Therefore, it might be reasonable to conclude that the people in the first graph are more similar than the two in the second graph, yet the correlation coefficient is the same. As such, the correlation coefficient misses important information. Euclidean Distance, d An alternative measure is the Euclidean distance. Euclidean distance is the geometric distance between two objects (or cases). Therefore, if we were to call George subject i and Zippy subject j, then we could express their Euclidean distance in terms of the following equation: (x x jk ).
10 P d ij =. 2. ik k =1. This equation simply means that we can discover the distance between Zippy and George by taking their scores on a variable, k, and calculating the difference. Now, for some variables Zippy will have a bigger score than George and for other variables George will have a bigger score than Zippy. Therefore, some differences will be positive and some negative. Eventually we want to add up the differences across a number of variables, and so if we have positive and negative difference they might cancel out. To avoid this problem, we simply square each difference before adding them up. OK, so far we've got Zippy and George's scores for variable k and we've calculated the difference and squared it.