Example: confidence
Control Charts - CRGRAPH Weibull-Analysen und …
1 Control Charts Introduction A Control Chart shows the time course of a process characteristic. For this purpose, data can be taken continuously or in periodic samples.
Tags:
Information
Domain:
Source:
Link to this page:
Documents from same domain

Fault Tree Analysis - Weibull
www.weibull.de© Copyright CRGRAPH 2017 www.crgraph.com Fault Tree Analysis P=0,001 Basic-Event Primary base event or failure. The probability P …
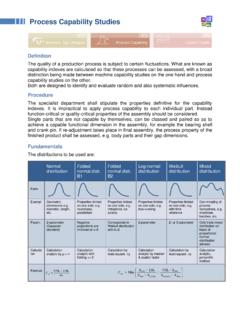
Process Capability Studies - Weibull
www.weibull.deProcess Capability Studies Calculation of the indexes for process capability Evaluation is carried out entirely in accordance with the evaluation strategy described in

Lebensdauertests - weibull.de
www.weibull.de© 2017 CRGRAPH Lebensdauertests Anwendung in Visual-XSel 14.0 www.crgraph.de Verwenden Sie für den Einstieg die Datenauswertung im Leitfaden, oder den Menüpunkt ...
Related documents

Methods for Estimating the Parameters of the …
interstat.statjournals.netMethods for Estimating the Parameters of the Weibull Distribution Mohammad A. Al-Fawzan King Abdulaziz City for Science and Technology P.O. Box 6086, Riyadh 11442, Saudi Arabia.

Do a Timeline Distribution Before doing a Weibull …
www.lifetime-reliability.comPhone: Fax: Email: Website: +61 (0) 402 731 563 +61 (8) 9457 8642 [email protected] www.lifetime-reliability.com Do a Timeline Distribution Before doing a Weibull Failure Analysis
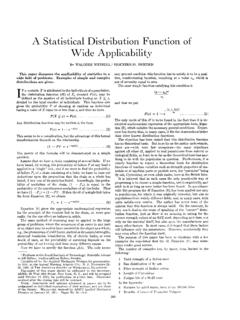
A Statistical Distribution Function of Wide …
web.cecs.pdx.eduA Statistical Distribution Function of Wide Applicability By WALODDI WEIBULL,l STOCKHOLM, SWEDEN This paper discusses the applicability of statistics to a

Statistical analysis of wind speed distribution …
www.cder.dzStatistical analysis of wind speed distribution based on six Weibull Methods for wind… 107 The maximum wind power density extracted by …
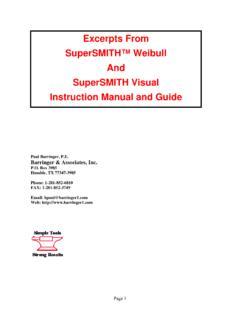
Excerpts From SuperSMITH™ Weibull And …
www.barringer1.comPage 3 Preface This manual is intended as a home study guide or a 1 to 2-day training class in how to use SuperSMITH Weibull and SuperSMITH Visual software for …
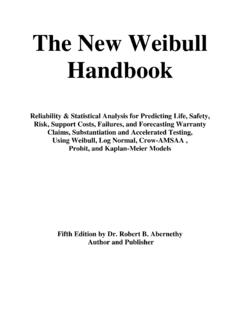
The New Weibull Handbook - Barringer1.com
www.barringer1.comThe New Weibull Handbook Reliability & Statistical Analysis for Predicting Life, Safety, Risk, Support Costs, Failures, and Forecasting Warranty
Identifying the distribution of data is key to analysis
www.minitab.comK nowing the distribution of your data is essential to choosing the right statistical method. Suppose you need to assess the capability of your process.

IN AD-A143 E103
www.dtic.milFOREWORD Advanced Weibull methods have been developed at Pratt & Whitney Aircraft in a joint effort between the Governmetit Products Division and the Commercial Products Division.
Related search queries
Methods for Estimating the Parameters, Methods for Estimating the Parameters of the Weibull Distribution, A Timeline Distribution Before doing a Weibull, Statistical Distribution Function of Wide, Statistical Distribution Function of Wide Applicability, Weibull, Statistical analysis of wind speed distribution, Weibull And, Weibull and SuperSMITH Visual, The New Weibull Handbook, Identifying the distribution of data, Distribution, IN AD-A143 E103