Transcription of CORRELATION AND REGRESSION
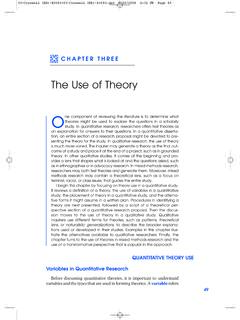
1 STATISTICS CORRELATION AND REGRESSION SESSION 10 STATISTICS SESSION 10 SESSION 10 CORRELATION and REGRESSION SIMULTANEOUSLY EQUATION MODELS CORRELATION and linear REGRESSION are the most commonly used techniques for investigating the relationship between two quantitative variables. The goal of a CORRELATION analysis is to see whether two measurement variables co vary, and to quantify the strength of the relationship between the variables, whereas REGRESSION expresses the relationship in the form of an equation. For example, in students taking a Maths and English test, we could use CORRELATION to determine whether students who are good at Maths tend to be good at English as well, and REGRESSION to determine whether the marks in English can be predicted for given marks in Maths. What a Scatter Diagram Tells Us The starting point is to draw a scatter of points on a graph, with one variable on the X-axis and the other variable on the Y-axis, to get a feel of the relationship (if any) between the variables as suggested by the data.
2 The closer the points are to a straight line, the stronger the linear relationship between two variables. Why Use CORRELATION ? We can use the CORRELATION coefficient, such as the Pearson Product Moment CORRELATION Coefficient, to test if there is a linear relationship between the variables. To quantify the strength of the relationship, we can calculate the CORRELATION coefficient (r). Its numerical value ranges from + to r > 0 indicates positive linear relationship, r < 0 indicates negative linear relationship while r = 0 indicates no linear relationship. A Caveat It must, however, be considered that there may be a third variable related to both of the variables being investigated, which is responsible for the apparent CORRELATION . CORRELATION does not imply causation . Also, a nonlinear relationship may exist between two variables that would be inadequately described, or possibly even undetected, by the CORRELATION coefficient.
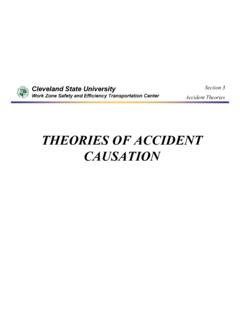
3 Why Use REGRESSION In REGRESSION analysis, the problem of interest is the nature of the relationship itself between the dependent variable (response) and the (explanatory) independent variable. The analysis consists of choosing and fitting an appropriate model , done by the method of least squares, with a view to exploiting the relationship between the variables to help estimate the expected response for a given value of the independent variable. For example, if we are interested in the effect of age on height, then by fitting a REGRESSION line, we can predict the height for a given age. Assumptions Some underlying assumptions governing the uses of CORRELATION and REGRESSION are as follows. The observations are assumed to be independent. For CORRELATION , both variables should be random variables, but for REGRESSION only the dependent variable Y must be random. In carrying out hypothesis tests, the response variable should follow Normal distribution and the variability of Y should be the same for each value of the predictor variable.
4 A scatter diagram of the data provides an initial check of the assumptions for REGRESSION . Uses of CORRELATION and REGRESSION There are three main uses for CORRELATION and REGRESSION . One is to test hypotheses about cause-and-effect relationships. In this case, the experimenter determines the values of the X-variable and sees whether variation in X causes variation in Y. For example, giving people different amounts of a drug and measuring their blood pressure. The second main use for CORRELATION and REGRESSION is to see whether two variables are associated, without necessarily inferring a cause-and-effect relationship. In this case, neither variable is determined by the experimenter; both are naturally variable. If an association is found, the inference is that variation in X may cause variation in Y, or variation in Y may cause variation in X, or variation in some other factor may affect both X and Y. The third common use of linear REGRESSION is estimating the value of one variable corresponding to a particular value of the other variable.
5 REGRESSION and CORRELATION analysis: REGRESSION analysis involves identifying the relationship between a dependent variable and one or more independent variables. A model of the relationship is hypothesized, and estimates of the parameter values are used to develop an estimated REGRESSION equation. Various tests are then employed to determine if the model is satisfactory. If the model is deemed satisfactory, the estimated REGRESSION equation can be used to predict the value of the dependent variable given values for the independent variables. REGRESSION model . In simple linear REGRESSION , the model used to describe the relationship between a single dependent variable y and a single independent variable x is y = a0 + a1x + k. a0and a1 are referred to as the model parameters, and is a probabilistic error term that accounts for the variability in y that cannot be explained by the linear relationship with x. If the error term were not present, the model would be deterministic; in that case, knowledge of the value of x would be sufficient to determine the value of y.
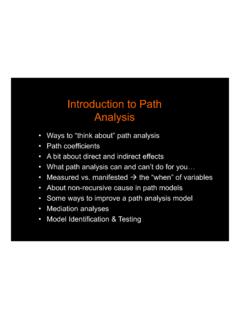
6 Least squares method. Either a simple or multiple REGRESSION model is initially posed as a hypothesis concerning the relationship among the dependent and independent variables. The least squares method is the most widely used procedure for developing estimates of the model parameters. As an illustration of REGRESSION analysis and the least squares method, suppose a university medical centre is investigating the relationship between stress and blood pressure. Assume that both a stress test score and a blood pressure reading have been recorded for a sample of 20 patients. The data are shown graphically in the figure below, called a scatter diagram. Values of the independent variable, stress test score, are given on the horizontal axis, and values of the dependent variable, blood pressure, are shown on the vertical axis. The line passing through the data points is the graph of the estimated REGRESSION equation: y = + The parameter estimates, b0 = and b1 = , were obtained using the least squares method CORRELATION .
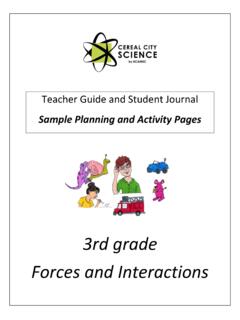
7 CORRELATION and REGRESSION analysis are related in the sense that both deal with relationships among variables. The CORRELATION coefficient is a measure of linear association between two variables. Values of the CORRELATION coefficient are always between -1 and +1. A CORRELATION coefficient of +1 indicates that two variables are perfectly related in a positive linear sense, a CORRELATION coefficient of -1 indicates that two variables are perfectly related in a negative linear sense, and a CORRELATION coefficient of 0 indicates that there is no linear relationship between the two variables. For simple linear REGRESSION , the sample CORRELATION coefficient is the square root of the coefficient of determination, with the sign of the CORRELATION coefficient being the same as the sign of b1, the coefficient of x1 in the estimated REGRESSION equation. Neither REGRESSION nor CORRELATION analyses can be interpreted as establishing cause-and-effect relationships.
8 They can indicate only how or to what extent variables are associated with each other. The CORRELATION coefficient measures only the degree of linear association between two variables. Any conclusions about a cause-and-effect relationship must be based on the judgment of the analyst. REGRESSION and CORRELATION analysis: REGRESSION analysis involves identifying the relationship between a dependent variable and one or more independent variables. A model of the relationship is hypothesized, and estimates of the parameter values are used to develop an estimated REGRESSION equation. Various tests are then employed to determine if the model is satisfactory. If the model is deemed satisfactory, the estimated REGRESSION equation can be used to predict the value of the dependent variable given values for the independent variables. REGRESSION model . In simple linear REGRESSION , the model used to describe the relationship between a single dependent variable y and a single independent variable x is y = a0 + a1x + k.
9 A0and a1 are referred to as the model parameters, and is a probabilistic error term that accounts for the variability in y that cannot be explained by the linear relationship with x. If the error term were not present, the model would be deterministic; in that case, knowledge of the value of x would be sufficient to determine the value of y. Least squares method. Either a simple or multiple REGRESSION model is initially posed as a hypothesis concerning the relationship among the dependent and independent variables. The least squares method is the most widely used procedure for developing estimates of the model parameters. As an illustration of REGRESSION analysis and the least squares method, suppose a university medical centre is investigating the relationship between stress and blood pressure. Assume that both a stress test score and a blood pressure reading have been recorded for a sample of 20 patients. The data are shown graphically in the figure below, called a scatter diagram.
10 Values of the independent variable, stress test score, are given on the horizontal axis, and values of the dependent variable, blood pressure, are shown on the vertical axis. The line passing through the data points is the graph of the estimated REGRESSION equation: y = + The parameter estimates, b0 = and b1 = , were obtained using the least squares method. CORRELATION . CORRELATION and REGRESSION analysis are related in the sense that both deal with relationships among variables. The CORRELATION coefficient is a measure of linear association between two variables. Values of the CORRELATION coefficient are always between -1 and +1. A CORRELATION coefficient of +1 indicates that two variables are perfectly related in a positive linear sense, a CORRELATION coefficient of -1 indicates that two variables are perfectly related in a negative linear sense, and a CORRELATION coefficient of 0 indicates that there is no linear relationship between the two variables.