Example: stock market
Creating Charts and Graphs - LibreOffice
Creating charts and graphs To demonstrate the process of creating charts and graphs in Calc, we will use example data as shown in Figure 1 to create a chart. Figure 1: Example data for creating a chart 1) Select the cells containing the data …
Tags:
Information
Domain:
Source:
Link to this page:
Documents from same domain

LibreOffice 4.3 Draw Guide
documentation.libreoffice.orgA few examples of the drawing functions are: layer management, snap functions and grid-point system, dimensions and measurement display, connectors for making organization charts, 3D functions that enable small three-dimensional drawings to be created (with texture and lighting effects), drawing and page-style integration, and Bézier curves.

Form Letters, Mailing Labels, and Envelopes
documentation.libreoffice.org2) How to create and print form letters, mailing labels, and envelopes. 3) Optionally, how to save the output in an editable file instead of printing it directly. Creating and registering the data source A data source is a database containing the name and address records (and optionally other information) from which a mailing list may be derived.
LibreOffice 7.2 Math Guide
documentation.libreoffice.orgFor quick tips when a toolbar is visible, place the mouse pointer over any of the icons to see a small box (“tooltip”) with a brief explanation of the icon’s function. For a more detailed explanation, select Help > What's This? and hold the pointer over the icon. In addition, you can choose whether to activate Extended Tips using Tools >

Working with Images - LibreOffice
documentation.libreoffice.orgIf color images are to be printed in grayscale, check that any adjacent colors have good contrast and print dark enough. Test by printing on a black-and-white printer using a grayscale setting. Better still: change the “mode” of the image to grayscale, either in a photo editor or in Writer itself (see “Graphics mode” on page 11).
Base Handbook - LibreOffice
documentation.libreoffice.orgdatabase programs, including Microsoft Access, MySQL, Oracle, and PostgreSQL. Base includes additional functionality that allows you to create full data-driven applications. This book introduces the features and functions of Base, using two example databases. • Creating a database • Accessing external databases
Chapter 12 Calc Macros - LibreOffice
documentation.libreoffice.orgIntroduction A macro is a saved sequence of commands or keystrokes that are stored for later use. An example of a simple macro is one that “types” your address. The LibreOffice macro language is very flexible, allowing automation of both simple and complex tasks. Macros are especially useful to repeat a task the same way over and over again.
LibreOffice Math Guide Version 7
documentation.libreoffice.orggiving a brief explanation of the function for that icon. For a more detailed explanation, select Help > What's This? on the main menu bar and hover the pointer over the icon. Free online support The LibreOffice community not only develops software, but provides free, volunteer-based ... free tips and tutorials. This forum provides support for ...

Adding and Formatting Text - LibreOffice
documentation.libreoffice.orgbulleted lists, tables, fields, and hyperlinks. Using the text tool To activate the text tool, click the Text icon for horizontal text or the Vertical Text icon for vertical text on the Drawing toolbar. If the Vertical Text icon is not visible, first select the option Show UI elements for East Asian
LibreOffice 3.5 Guida a Draw
documentation.libreoffice.orgAlcuni esempi delle funzioni di disegno sono: gestione dei livelli, griglia magnetica, visualizzazione di dimensioni e misure, connettori per creare organigrammi, funzioni 3D per creare piccoli disegni tridimensionali (con trame ed effetti di luce), integrazione di disegni e stili di pagina, e le curve di Bézier.

Formulas and Functions - LibreOffice
documentation.libreoffice.orgIntroduction In previous chapters, we have been entering one of two basic types of data into each cell: numbers and text. However, we will not always know what the contents should be. Often the contents of one cell depends on the contents of other cells. To handle this situation, we use a third type of data: the formula. Formulas are equations ...
Related documents
Delaunay Triangulations - MIT
web.mit.edu• Create angle vector of the sorted angles of triangulation T, (α 1, α 2, α 3, … α 3m) = A(T) with α 1 being the smallest angle • A(T) is larger than A(T’) iff there exists an i such that α j = α’ j for all j < i and α i > α’ i • Best triangulation is triangulation that is …
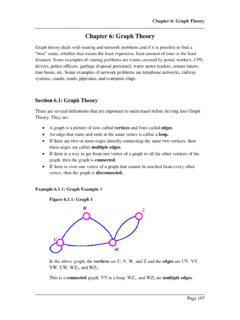
Chapter 6: Graph Theory
www.coconino.edua cost of nine million dollars, but that would create a red circuit so we cannot use it. Therefore, the next cheapest link after that is between E and F with a cost of 12 million dollars, which we are able to use. We cannot use the link between C and D which also has a cost of 12 million dollars because it would create a red circuit.

Interpreting Function Graphs Algebra - AGMath.com
www.agmath.comThese graphs look very different from graphs representing speed versus time. total distance (miles) time (minutes) 0 20 10 20 30 Dan’s Drive to Work 30 10 speed (mph) time (minutes) 0 20 25 50 30 Dan’s Drive to Work 75 10 Use a sheet of graph paper to graph the following: 1. The distance you are from your locker from 7:20-12:20. 2.