Example: air traffic controller
Interpreting Function Graphs Algebra - AGMath.com
These graphs look very different from graphs representing speed versus time. total distance (miles) time (minutes) 0 20 10 20 30 Dan’s Drive to Work 30 10 speed (mph) time (minutes) 0 20 25 50 30 Dan’s Drive to Work 75 10 Use a sheet of graph paper to graph the following: 1. The distance you are from your locker from 7:20-12:20. 2.
Tags:
Information
Domain:
Source:
Link to this page:
Documents from same domain
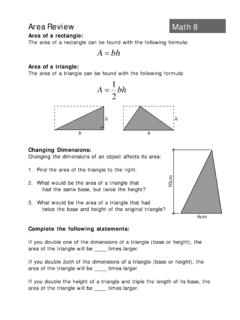
Area Review Math 8 - AGMath.com
www.agmath.comMath 8 Area of a triangle: The area of a triangle can be found with the following formula: Area Review b h b h A bh 2 1 Area of a rectangle: The area of a rectangle can be found with the following formula:

Name Period Segments and Angles Geometry 3
www.agmath.comSegments and Angles Geometry 3.2 Name_____ Period _____ All constructions done today will be with Compass and Straight-Edge ONLY.
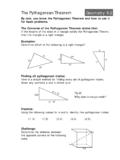
The Pythagorean Theorem 9.2 Geometry - …
www.agmath.comGeometry Practice: Solve for x in each. Leave answers in simplified radical form. The Pythagorean Theorem 9.2 6m 4m x 15m 20m 17m x 8m x 4m Practice: Find the shortest distance between each pair of

24th AMC 8 - AGMath.com
www.agmath.com24th AMC 8 2008 2 1. Susan had $50 to spend at the carnival. She spent $12 on food and twice as much on rides. How many dollars did she have left to spend?
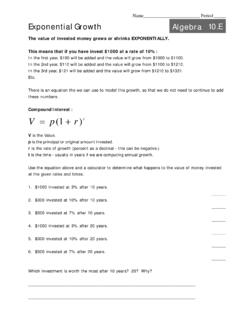
Name Period Exponential Growth Algebra 10 - …
www.agmath.comExponential Growth Algebra 10.E For each problem, graph the equations and answer the questions that follow. V p(1 r)t 1. You have $100 invested in an account that earns 7% interest annually, and $200 in an account
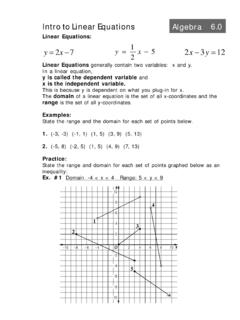
Intro to Linear Equations Algebra 6 - AGMath.com
www.agmath.comIntro to Linear Equations Algebra 6.0 Linear Equations: y 2x 7 5 2 1 y x 2x 3y 12 Linear Equations generally contain two variables: x and y. In a linear equation, y is called the dependent variable and

Polynomials, FOIL, and Factoring EOC REVIEW
www.agmath.comEOC REVIEW Factoring: Special Products. Example: Factor. 1. 9x2 42x 49 2.9x2 64 Practice: Special Products. Factor each. 1. 4x2 20x 25 2.121x2 1 Factoring…

Triangle Basics Geometry 4 - AGMath.com
www.agmath.comGeometry Mathematical Proof takes an accepted set of facts and properties to demon- strate something to be true. In a two-column proof, statements are …

Graphing a System of Equations Algebra 7 - AGMath.com
www.agmath.comGraphing a System of Equations Algebra 7.1 Given two equations, the solution is the point that satisfies both. Graphing is the first way we will learn to solve a system of equations.

Name Period Segments and Angles Geometry 3
www.agmath.comSegments and Angles Geometry 3.1 Name_____ Period _____ Use what you have learned to duplicate each of the objects below: E W X Y
Related documents
Delaunay Triangulations - MIT
web.mit.edu• Create angle vector of the sorted angles of triangulation T, (α 1, α 2, α 3, … α 3m) = A(T) with α 1 being the smallest angle • A(T) is larger than A(T’) iff there exists an i such that α j = α’ j for all j < i and α i > α’ i • Best triangulation is triangulation that is …

Creating Charts and Graphs - LibreOffice
documentation.libreoffice.orgCreating charts and graphs To demonstrate the process of creating charts and graphs in Calc, we will use example data as shown in Figure 1 to create a chart. Figure 1: Example data for creating a chart 1) Select the cells containing the data …
Chapter 6: Graph Theory
www.coconino.edua cost of nine million dollars, but that would create a red circuit so we cannot use it. Therefore, the next cheapest link after that is between E and F with a cost of 12 million dollars, which we are able to use. We cannot use the link between C and D which also has a cost of 12 million dollars because it would create a red circuit.