Transcription of CRITICAL-PATH ANALYSIS FOR NETWORK SCHEDULING
1 47 CRITICAL-PATH ANALYSIS FOR NETWORK SCHEDULING From studying this section, you will be able to: - Perform CPM and PDM analyses for AOA and AON networks; - Calculate the early / late times that an activity can start / finish; - Determine the total project duration, activity floats, and the path of critical activities; - Represent the schedule using Bar charts (Gantt charts); - Use Microsoft Project Software to schedule projects; and - Experiment with a spreadsheet model for NETWORK ANALYSIS . SCHEDULING = Planning + Time. The schedule is very important for the contractor to know when and how much labor is needed; vendors to know when to deliver materials; and subcontractors to know when they can do their work.
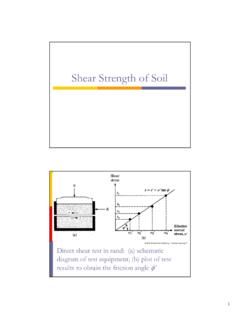
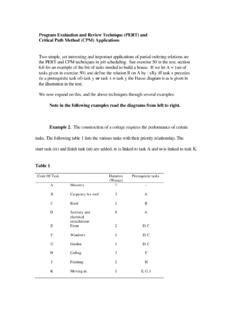
2 CRITICAL-PATH Method (CPM) for AOA Networks The CPM is a systematic SCHEDULING method for AOA NETWORK . The CPM involves 4 main steps: - A forward pass to determine activities early-start times; - A backward pass to determine activities late-finish times; - Float calculations; and - Identifying critical activities. Forward Pass & Backward Pass The forward pass determines the early-start times of activities, while the backward pass determines the late-finish (LF) times. Float Calculations Results of Forward & Backward Pass Calculations of Other Activity Times Total Float & Criticality Calculations Activity Duration (d) (ES) (LF) LS = LF - dEF = ES + dTF = LF- ES - d critical (Y/N) A B C D E 3 3 4 6 5 B (3) d1 A (3) C (4) E (5) D (6) d2 1 3 57911 48 Total Float (TF)
3 = Total Slack = LF EF = LS ES = LF ES d Another type of float often used in NETWORK ANALYSIS is the Free Float, which can be calculated as: Free Float = Es (of succeeding activity) EF (of activity in question) The free float defines the amount of time that an activity can be delayed without taking float away from any other activity. With free float available for an activity, a project manager knows that the float can be used without changes the status of any non- critical activity to become critical . Identifying critical Activities critical activities are the ones having TF = 0. They form a continuous path of the critical activities that is the longest in the NETWORK ( critical path ).
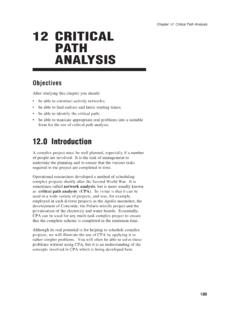
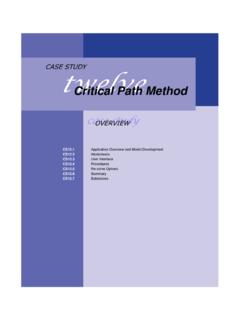
4 Precedence Diagram Method (PDM) for AON Networks A (3) D (6) C (4) E (5) B (3) Sequence 1 2 3 Step ES EF=ES+d d TF LS=LF-d TF d LF Total time available for the activity = LF - ES iiName duration = da) Activity is early b)
5 Activity is late LF ES 49 Schedule Presentation d=3 ES = 0 d=3 TF=3 ES=3 d=4 TF=2 ES=3 d=6 ES=3 d=5 ES=9 A B C D E Activity 0 1 2 3 4 5 6 7 8 9 10 11 12 13 14 Time Early Bar Chart d=3 LF=3 TF=3 d=3 LF=9 TF=2 d=4
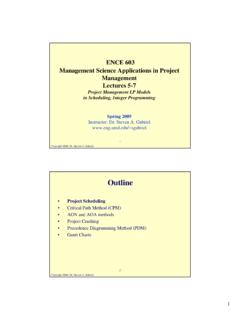
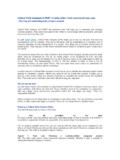
6 LF=9 d=6 LF=9 d=5 A B C D E Activity 0 1 2 3 4 5 6 7 8 9 10 11 12 13 14 Time LF=14 Late Bar Chart Profile of the labor resource demand 6 5 4 3 2 1 1 2 3 4 6 Using Bar Chart to Accumulate Resources 2 2 2 Labor amount / day 2 2 2 1 1 1 1 3 3 3 3 3 3 1 1 1 1 1 0 1 2 3 4 5 6 7 8 9 10 11 12 13 14 Time 2 2 2 6 6 6 4 3 3 1 1 1 1 1 Total labors Activity A B C D E 50 Example Solved Example Perform PDM calculations for the small AON NETWORK shown here.
7 Pay special attention to the different relationships and the lag times shown on them. Criticisms to NETWORK Techniques - Assume all required resources are available - Can result in large resource fluctuations - Ignore project deadline - Ignore project costs - Use deterministic durations - Do not consider realistic productivity factors D (6) 4 10 3 9 B (3) 4 7 2 5 C (4) 3 7 3 7 A (3) 0 3 0 3 E (5) 7 12 7 12 12-2=104 or 3 or (4-2+3) SS=2 FF=25, 7 or (9+2-5)0+2=2 51 Back to Our Case Study Project We need to do the following: - Calculate ES, LF, & TF for all activities. Identify critical ones. Draw a Late Bar Chart for the project. - What is the effect of delaying activity H by two days on project duration?
8 Solution: Activity Duration ES LF TF=LF-ES-d critical A 4 B 6 C 2 D 8 E 4 F 10 G 16 H 8
9 I 6 J 6 K 10 ACTIVITY 1 2 3 4 5 67 8 9 10 11 12 13 14 15 16 17 18 19 20 21 22 23 24 25 26 27 28 29 30A B C D E F G H I J K 31 32 52 DelayBDelayC DelayD critical path Model on a Spreadsheet The spreadsheet file ( ) represents a template for CPM ANALYSIS with one row for each activity.
10 The data for an activity are represented in columns. The shaded cells include formulas while the white cells are user inputs pertaining to the activity ID, Name, Duration, Cost, IDs of 3 predecessors, IDs of 3 successors, and a Delay value. The total project duration (32 days) is also included in a separate cell at the top of the spreadsheet. Any change in the duration of any activity or the logical relationships automatically changes the project duration along with all the CPM data regarding the activities early and late times as well as the total floats, which identify critical and non- critical activities. Experiment with different option and see their impact on the schedule.