Transcription of Customizing the Kaplan-Meier Survival Plot - SAS
1 SAS/STAT User s GuideCustomizing theKaplan- meier SurvivalPlotThis document is an individual chapter fromSAS/STAT User s correct bibliographic citation for the complete manual is as follows: SAS Institute Inc. User s , NC: SAS Institute 2013, SAS Institute Inc., Cary, NC, USAAll rights reserved. Produced in the United States of a hard-copy book: No part of this publication may be reproduced, stored in a retrieval system, or transmitted, in any form or byany means, electronic, mechanical, photocopying, or otherwise, without the prior written permission of the publisher, SAS a web download or e-book: Your use of this publication shall be governed by the terms established by the vendor at the timeyou acquire this scanning, uploading, and distribution of this book via the Internet or any other means without the permission of the publisher isillegal and punishable by law.
2 Please purchase only authorized electronic editions and do not participate in or encourage electronicpiracy of copyrighted materials. Your support of others rights is Government License Rights; Restricted Rights:The Software and its documentation is commercial computer softwaredeveloped at private expense and is provided with RESTRICTED RIGHTS to the United States Government. Use, duplication ordisclosure of the Software by the United States Government is subject to the license terms of this Agreement pursuant to, asapplicable, FAR , DFAR (a), DFAR (a) and DFAR and, to the extent required under law, the minimum restricted rights as set out in FAR (DEC 2007). If FAR is applicable, this provisionserves as notice under clause (c) thereof and no other notice is required to be affixed to the Software or documentation.
3 TheGovernment s rights in Software and documentation shall be only those set forth in this Institute Inc., SAS Campus Drive, Cary, North Carolina 2013 SAS provides a complete selection of books and electronic products to help customers use SAS software to its fullest potential. Formore information about our offerings, call and all other SAS Institute Inc. product or service names are registered trademarks or trademarks of SAS Institute Inc. in theUSA and other countries. indicates USA brand and product names are trademarks of their respective and all other SAS Institute Inc. product or service names are registered trademarks or trademarks of SAS Institute Inc. in the USA and other countries. indicates USA registration. Other brand and product names are trademarks of their respective companies.
4 2013 SAS Institute Inc. All rights reserved. all that you need on your journey to knowledge and additional books and Greater Insight into Your SAS Software with SAS 23 Customizing the Kaplan-Meier Survival PlotContentsOverview ..780 Controlling the Survival plot by Specifying Procedure Options ..781 Enabling ODS Graphics and the Default Kaplan-Meier plot ..781 Individual Survival Plots ..783 Hall-Wellner Confidence Bands and Homogeneity Test ..785 Equal-Precision Bands ..786 Displaying the Patients-at-Risk Table inside the plot ..788 Displaying the Patients-at-Risk Table outside the plot ..790 Modifying At-Risk Table Times ..791 Reordering the Groups ..794 Suppressing the Censored Observations ..797 Failure Plots ..798 Controlling the Survival plot by Modifying Graph Templates.
5 799 The Modularized Templates ..799 Changing the plot Title ..801 Modifying the Axis ..803 Changing the Line Thickness ..805 Changing the Group Color ..806 Changing the Line Pattern ..807 Changing the Font ..808 Changing the Legend and Inset Position ..810 Changing How the Censored Points Are Displayed ..812 Adding a Y-Axis Reference Line ..813 Changing the Homogeneity Test Inset ..815 Suppressing the Second Title and Adding a Footnote ..817 Adding a small Inset Table with Event Information ..818 Adding an External Table with Event Information ..820 Suppressing the Legend ..822 Kaplan-Meier plot with Event Table and Other Customizations ..823 Compiled Template Cleanup ..824 Graph Templates, Macros, and Macro Variables ..825 The Macro Variables.
6 827 The Smaller Macros ..830 The Larger Macros ..830 Event Table Macros ..835780 FChapter 23: Customizing the Kaplan-Meier Survival PlotDynamic Variables ..837 Dynamic Variables That Are Automatically Declared ..837 Additional Dynamic Variables ..838 Style Templates ..839 Changing the Style ..840 Color Priority Styles ..841 Displaying a Style and Extracting Color Lists ..842 Modifying Color Lists ..845 Swapping Colors among Style Elements ..846 Displaying a Style and Extracting Font Information ..848 Displaying Other Style Elements ..850 SAS Item Stores ..851 References ..853 OverviewThe LIFETEST procedure is a nonparametric procedure for analyzing Survival data. You can use PROCLIFETEST to compute the Kaplan-Meier curve (1958), which is a nonparametric maximum likelihoodestimate of the survivor function.
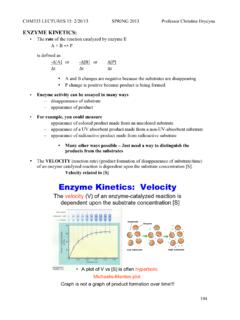
7 The Kaplan-Meier plot (also called the product-limit Survival plot ) is apopular tool in medical, pharmaceutical, and life sciences research. The Kaplan-Meier plot contains stepfunctions that represent the Kaplan-Meier curves of different samples (strata). The Kaplan-Meier plot hasmany other features that you can add or change through procedure options, graph templates, and styletemplates. This chapter explores these features in detail but does not explain how to interpret the graphsor the underlying analysis. For more information about PROC LIFETEST and the Kaplan-Meier plot , seeChapter 56, The LIFETEST Procedure. This chapter shows you how to modify the Kaplan-Meier plot through a series of examples. It discussesfour types of examples: specifying procedure options, modifying graph templates by using macro variables,modifying graph templates by using macros, and changing styles.
8 Most examples do not go into detail aboutthe tools that underlie the template changes. Each example is designed to be small , simple, self-contained,and easy to copy and use as is or with minor modifications. Subsequent sections provide more detailsabout the macro variables and macros that are used to modify the graph templates. You can use the simpleexamples to make a wide variety of changes without reading or understanding the detailed descriptions at theend of this procedures produce tables by using the Output Delivery System (ODS) and produce graphs byusing ODS Graphics. Procedures produce graphs as automatically as they produce tables, and graphs andtables are integrated in the ODS output. Graphs that are produced by ODS Graphics are controlled by options,the data object (the matrix of information that is graphed), a style template, and a graph template.
9 A styletemplate is a SAS program that controls the overall appearance of graphs, including colors, line and markerstyles, sizes, fonts, and so on. A graph template is a SAS program, written in the Graph Template LanguageControlling the Survival plot by Specifying Procedure OptionsF781(GTL), that provides a detailed specification of the layout and contents of each graph. Each graph that iscreated when ODS Graphics is enabled is controlled by a graph you want to modify a graph template, you usually use the TEMPLATE procedure to display the templateof interest, and then you copy it into your editor, modify it, and submit it to SAS to compile. Then, when yourun your procedure, it uses the new template. The PROC LIFETEST Survival plot is the only plot in SASfor which you have another alternative available for template modification.
10 SAS provides the Survival plottemplates in a series of macros and macro variables that are modular and easier to modify than the originaltemplates. This chapter provides numerous examples of using these macros and macro data that are used in this chapter come from 137 bone marrow transplant patients in a study by Klein andMoeschberger (1997) and are available in theBMTdata set in theSashelplibrary. At the time of transplant,each patient is classified in one of three risk categories: ALL (acute lymphoblastic leukemia), AML (acutemyelocytic leukemia) Low Risk, and AML High Risk. The endpoint of interest is the disease-free survivaltime, which is the time in days until death, relapse, or the end of the study. The variableGrouprepresents thepatient s risk category, the variableTrepresents the disease-free Survival time, and the variableStatusis thecensoring indicator.