Transcription of Data transformation with dplyr : : CHEAT SHEET
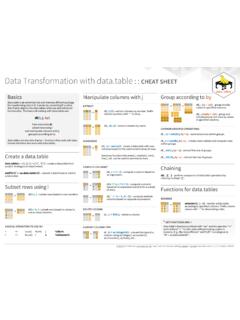
1 Data transformation with dplyr : : CHEAT SHEET . dplyr functions work with pipes and expect tidy data. In tidy data: A B C A B C. Manipulate Cases Manipulate Variables &. pipes EXTRACT CASES EXTRACT VARIABLES. Row functions return a subset of rows as a new table. Column functions return a set of columns as a new vector or table. Each variable is in Each observation, or x %>% f(y). its own column case, is in its own row becomes f(x, y) filter(.data, , .preserve = FALSE) Extract rows pull(.data, var = -1, name = NULL, ) Extract Summarise Cases w www ww that meet logical criteria. filter(mtcars, mpg > 20) w www column values as a vector, by name or index. pull(mtcars, wt). distinct(.data, , .keep_all = FALSE) Remove select(.data, ) Extract columns as a table. w www Apply summary functions to columns to create a new table of w www ww rows with duplicate values.
2 Select(mtcars, mpg, wt). summary statistics. Summary functions take vectors as input and distinct(mtcars, gear). return one value (see back). relocate(.data, , .before = NULL, .a er = NULL). slice(.data, , .preserve = FALSE) Select rows w www ww summary function Move columns to new position. by position. relocate(mtcars, mpg, cyl, .a er = last_col()). slice(mtcars, 10:15). summarise(.data, ). w ww w www ww Compute table of summaries. slice_sample(.data, , n, prop, weight_by =. summarise(mtcars, avg = mean(mpg)) NULL, replace = FALSE) Randomly select rows. Use these helpers with select() and across(). Use n to select a number of rows and prop to select(mtcars, mpg:cyl). count(.data, , wt = NULL, sort = FALSE, name = select a fraction of rows. contains(match) num_range(prefix, range) :, mpg:cyl NULL) Count number of rows in each group slice_sample(mtcars, n = 5, replace = TRUE) ends_with(match) all_of(x)/any_of(x, , vars) -, , -gear w ww defined by the variables in Also tally().
3 Starts_with(match) matches(match) everything(). count(mtcars, cyl) slice_min(.data, order_by, , n, prop, with_ties = TRUE) and slice_max() Select rows with the lowest and highest values. MANIPULATE MULTIPLE VARIABLES AT ONCE. Group Cases w www ww slice_min(mtcars, mpg, prop = ). across(.cols, .funs, , .names = NULL) Summarise slice_head(.data, , n, prop) and slice_tail(). w ww Use group_by(.data, , .add = FALSE, .drop = TRUE) to create a or mutate multiple columns in the same way. Select the first or last rows. summarise(mtcars, across(everything(), mean)). "grouped" copy of a table grouped by columns in .. dplyr slice_head(mtcars, n = 5). functions will manipulate each "group" separately and combine the results. c_across(.cols) Compute across columns in w ww Logical and boolean operators to use with filter() row-wise data. == < <= () %in% | xor() transmute (rowwise(UKgas), total = sum(c_across(1:2))).
4 W www ww mtcars %>% != > >= ! () ! &. w group_by(cyl) %>% MAKE NEW VARIABLES. summarise(avg = mean(mpg)) See ?base::Logic and ?Comparison for help. Apply vectorized functions to columns. Vectorized functions take vectors as input and return vectors of the same length as output ARRANGE CASES (see back). Use rowwise(.data, ) to group data into individual rows. dplyr vectorized function arrange(.data, , .by_group = FALSE) Order functions will compute results for each row. Also apply functions w www ww rows by values of a column or columns (low to to list-columns. See tidyr CHEAT SHEET for list-column workflow. high), use with desc() to order from high to low. mutate(.data, , .keep = "all", .before = NULL, w www ww arrange(mtcars, mpg) .a er = NULL) Compute new column(s). Also starwars %>% arrange(mtcars, desc(mpg)) add_column(), add_count(), and add_tally().
5 Ww www ww mutate(mtcars, gpm = 1 / mpg). w w rowwise() %>%. mutate(film_count = length(films)). ADD CASES transmute (.data, ) Compute new column(s), ungroup(x, ) Returns ungrouped copy of table. add_row(.data, , .before = NULL, .a er = NULL). w ww drop others. transmute (mtcars, gpm = 1 / mpg). w www ww Add one or more rows to a table. ungroup(g_mtcars) add_row(cars, speed = 1, dist = 1) rename(.data, ) Rename columns. Use w wwww rename_with() to rename with a function. rename(cars, distance = dist). RStudio is a trademark of RStudio, PBC CC BY SA RStudio 844-448-1212 Learn more at dplyr Updated: 2021-07. ft ft ft ft Vectorized Functions Summary Functions Combine Tables TO USE WITH MUTATE () TO USE WITH SUMMARISE () COMBINE VARIABLES COMBINE CASES. mutate() and transmute () apply vectorized summarise() applies summary functions to x y functions to columns to create new columns.
6 Columns to create a new table. Summary A B C E F G A B C E F G A B C. Vectorized functions take vectors as input and return vectors of the same length as output. functions take vectors as input and return single values as output. a b c t u v 1. 2. 3. + a b d t u w 3. 2. 1. = a b c t u v 1. 2. 3. a b d t u w 3. 2. 1. x a t 1. b u 2. A B C. vectorized function summary function bind_cols( , .name_repair) Returns tables placed side by side as a single table. Column + y c v 3. d w 4 bind_rows( , .id = NULL). Returns tables one on top of the lengths must be equal. Columns will NOT be DF A B C other as a single table. Set .id to matched by id (to do that look at Relational Data x a t 1. a column name to add a column OFFSET COUNT below), so be sure to check that both tables are x y b c u v 2. 3 of the original table names (as dplyr ::lag() - o set elements by 1 dplyr ::n() - number of values/rows ordered the way you want before binding.)
7 Y d w 4 pictured). dplyr ::lead() - o set elements by -1 dplyr ::n_distinct() - # of uniques sum(! ()) - # of non-NA's RELATIONAL DATA. CUMULATIVE AGGREGATE. POSITION Use a "Mutating Join" to join one table to Use a "Filtering Join" to filter one table against dplyr ::cumall() - cumulative all() columns from another, matching values with the the rows of another. dplyr ::cumany() - cumulative any() mean() - mean, also mean(! ()) rows that they correspond to. Each join retains a cummax() - cumulative max() median() - median x y di erent combination of values from the tables. dplyr ::cummean() - cumulative mean() A B C A B D. cummin() - cumulative min(). cumprod() - cumulative prod(). LOGICAL. A B C D le _join(x, y, by = NULL, copy = FALSE, a b c t u v 1. 2. 3. + a b d t u w 3. 2. 1. =. mean() - proportion of TRUE's cumsum() - cumulative sum() sum() - # of TRUE's a t 1 3.
8 Su ix = c(".x", ".y"), , keep = FALSE, b u 2 2. na_matched = "na") Join matching A B C semi_join(x, y, by = NULL, copy = FALSE, RANKING. c v 3 NA. values from y to x. a t 1. b u 2. , na_matches = "na") Return rows of x ORDER that have a match in y. Use to see what dplyr ::cume_dist() - proportion of all values <= dplyr ::first() - first value will be included in a join. dplyr ::dense_rank() - rank w ties = min, no gaps A B C D right_join(x, y, by = NULL, copy = FALSE, dplyr ::last() - last value a t 1 3. su ix = c(".x", ".y"), , keep = FALSE, dplyr ::min_rank() - rank with ties = min dplyr ::nth() - value in nth location of vector b u 2 2 A B C anti_join(x, y, by = NULL, copy = FALSE, dplyr ::ntile() - bins into n bins na_matches = "na") Join matching d w NA 1. values from x to y. c v 3. , na_matches = "na") Return rows of x dplyr ::percent_rank() - min_rank scaled to [0,1] RANK that do not have a match in y.
9 Use to see dplyr ::row_number() - rank with ties = "first" what will not be included in a join. quantile() - nth quantile A B C D inner_join(x, y, by = NULL, copy = FALSE, MATH min() - minimum value a t 1 3. su ix = c(".x", ".y"), , keep = FALSE, b u 2 2. na_matches = "na") Join data. Retain Use a "Nest Join" to inner join one table to max() - maximum value another into a nested data frame. +, - , *, /, ^, %/%, %% - arithmetic ops only rows with matches. log(), log2(), log10() - logs SPREAD. <, <=, >, >=, !=, == - logical comparisons A B C y nest_join(x, y, by = NULL, copy =. A B C D full_join(x, y, by = NULL, copy = FALSE, a t 1 <tibble [1x2]>. FALSE, keep = FALSE, name =. dplyr ::between() - x >= le & x <= right IQR() - Inter-Quartile Range a t 1 3. su ix = c(".x", ".y"), , keep = FALSE, b u 2 <tibble [1x2]>. dplyr ::near() - safe == for floating point numbers mad() - median absolute deviation b u 2 2 c v 3 <tibble [1x2]> NULL, ) Join data, nesting c v 3 NA na_matches = "na") Join data.
10 Retain all matches from y in a single new sd() - standard deviation d w NA 1 values, all rows. MISCELLANEOUS var() - variance data frame column. dplyr ::case_when() - multi-case if_else(). starwars %>%. mutate(type = case_when(. Row Names COLUMN MATCHING FOR JOINS SET OPERATIONS. Tidy data does not use rownames, which store a A B C intersect(x, y, ). height > 200 | mass > 200 ~ "large", A C D Use by = c("col1", "col2", ) to variable outside of the columns. To work with the c v 3. Rows that appear in both x and y. species == "Droid" ~ "robot", a t 1 t 3. specify one or more common TRUE ~ "other") rownames, first move them into a column. b u 2 u 2. columns to match on. c v 3 NA NA. setdi (x, y, ). ) tibble::rownames_to_column() le _join(x, y, by = "A") A B C. A B. a t 1 Rows that appear in x but not y. dplyr ::coalesce() - first non-NA values by 1 a t C.