Example: confidence
Data Visualization with ggplot2 : : CHEAT SHEET
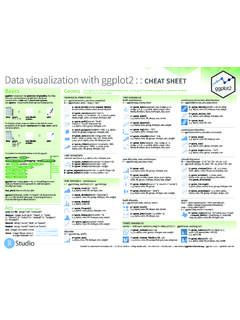
Data Visualization with ggplot2 : : CHEAT SHEET ggplot2 is based on the grammar of graphics, the idea that you can build every graph from the same components: a data set, a coordinate system, and geoms—visual marks that represent data points.
Tags:
Information
Domain:
Source:
Link to this page:
Documents from same domain
The University of Sydney
www.maths.usyd.edu.auThe University of Sydney School of Mathematics and Statistics NSW 2006 Australia Sydney University Mathematical Society Problem Competition 2009 1. The sisters Alice, Bess, and Cath have become proficient at fa ctorizing numbers, so their father David invents a puzzle for them. He chooses three secret integers a,b,c, all greater than 1, and

The University of Sydney - maths.usyd.edu.au
www.maths.usyd.edu.auSUMS Problem Competition 2007 Page 3 whose first coordinate x1 is either 0 or 1, while the females are those such that x1 is either α or α +1. To construct the schedule, we index the rounds by the one-dimensional F4-subspaces of Fn 4.

-INVESTIGATIONS ON THE THEORY .OF ,THE BROWNIAN …
www.maths.usyd.edu.au(*) A. Einstein, Ann. d. Phys., 11, p. 170, 1903. MOVEMENT OF SMALL PARTICLES g and 3F RT RT p=-alr*=Y*lCi=Nv* It has been shown by this analysis that the exist- ence of an osmotic pressure can be deduced from the molecular-kinetic theory of Heat ; and that as far as osmotic pressure is concerned, solute

10 Hypothesis Testing with Two Independent Samples
www.maths.usyd.edu.au• the one-sample z-test for population proportion p, based on one sample; ... existing techniques are revised. Advances occur whenever a new technique is proved to be better than the old. Hence we need ... One-sided t-test-2.262 0 1.94 t9 P-value=0.084 a=0.05 (RR) 0.042 0.042

1.Cochran, W.G. (1963) Sampling Techniques Survey …
www.maths.usyd.edu.au4.Systematic sampling and cluster sampling. 5.Sampling with unequal probabilities. Probability proportional to size(PPS) sampling. The Horvitz-Thompson estimator. SydU STAT3014 (2015) Second semester Dr. J. Chan 1. STAT3014/3914 Applied …

A short list of the most useful R commands
www.maths.usyd.edu.auA short list of the most useful R commands A summary of the most important commands with minimal examples. See the relevant part of the guide for better examples.

8: The Black-Scholes Model - University of Sydney
www.maths.usyd.edu.auThe Black-Scholes Model M = (B,S) Assumptions of the Black-Scholes market model M = (B,S): There are no arbitrage opportunities in the class of trading strategies. It is possible to borrow or lend any amount of cash at a constant interest rate r ≥ 0. The stock price dynamics are governed by a geometric Brownian motion.
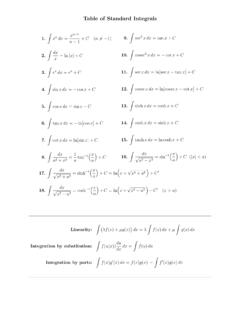
Table of Standard Integrals - University of Sydney
www.maths.usyd.edu.auTable of Standard Integrals 1. Z xn dx= xn+1 n+1 +C (n6= 1) 2. Z dx x = lnjxj+C 3. Z e xdx= e +C 4. Z sinxdx= cosx+C 5. Z cosxdx= sinx+C 6. Z tanxdx= ln cosx +C 7. Z cotxdx= ln sinx
Related documents

A Step-by-Step Guide to Advanced Data Visualization
policyviz.comBasic Data Visualization Principles 6 . Basic Data Visualization Principles . This guide is not intended to be an introductory guide to best practices in data visualization. Instead, it is intended to show you how to extend the capabilities of Microsoft Excel so that you can create more and better visualizations.

ggmap: Spatial Visualization with ggplot2
journal.r-project.orgCONTRIBUTED RESEARCH ARTICLES 144 ggmap: Spatial Visualization with ggplot2 by David Kahle and Hadley Wickham Abstract In spatial statistics the ability to visualize data and models superimposed with their basic social landmarks and geographic context is invaluable. ggmap is a new tool which enables such visualization by combining the spatial information of …

Problem Statement 1 - IBM
www.ibm.comStage 1 – Extract Wikipedia plots data from Wikipedia-data folder and try to construct a different and unbiased version of a story. Stage 2 – Use attention model to pin point various parts in the story and then debias those parts. Further show these nodes in an interactive visualization.

NANODEGREE PROGRAM SYLLABUS Data Analysis and ...
d20vrrgs8k4bvw.cloudfront.netdata visualization and report design skills learned in the course while also challenging them to implement a variety of interactive features that can enhance the user experience. By the end of the project, students will have designed a detailed Power BI report
Data Visualization
datax.berkeley.eduData visualization is the graphical representation of information and data. What are the advantages of data visualization? Makes for easier interpretation of patterns and trends as opposed to looking at data in a tabular/spreadsheet format. What makes for …
Data Visualization - Stats and R
statsandr.comfew components: a data set, a set of geoms—visual marks that represent data points, and a coordinate system. To display data values, map variables in the data set to aesthetic properties of the geom like size, color, and x and y locations. Graphical Primitives Data Visualization with ggplot2 Cheat Sheet

Visualization Solutions Selection Guide
literature.rockwellautomation.comVisualization products from Rockwell Automation comprise a suite of scalable HMI software and operator interface hardware that provide plant floor machine operators, supervisors, engi neers, and business managers a window to critical data and production and process information.

Quadro Pascal P400 Data Sheet - Nvidia
www.nvidia.comTitle: Datasheet Quadro P400 Author: NVIDIA Corporation Subject: Tech specs of Quadro P400, 2 GB GDDR5, 256 CUDA core Pascal GPU Created Date: 5/25/2018 11:38:33 AM
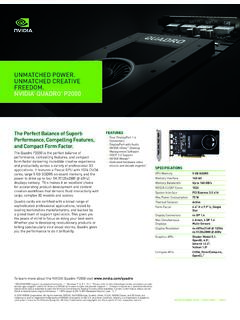
Datasheet Quadro P2000 - Nvidia
www.nvidia.comTitle: Datasheet Quadro P2000 Author: NVIDIA Corporation Subject: Tech specs of Quadro P2000, 5 GB GDDR5 memory, 1024 CUDA cores with Pascal GPU