Transcription of Dell PowerEdge C4130 & NVIDIA Tesla K80 GPU …
1 JANUARY 2015 A PRINCIPLED TECHNOLOGIES TEST REPORT Commissioned by dell Inc. dell PowerEdge C4130 & NVIDIA Tesla K80 GPU ACCELERATORS Organizations running the more than 200 available high-performance computing (HPC) applications know that computational performance is their top priority for getting results faster. In recent years, one approach to achieving increased compute power has been to add graphics processing units (GPUs) that can handle the complex and demanding compute requirements, such as the NVIDIA Tesla K80 GPU accelerators, to server hardware designed to support them. The new dell PowerEdge C4130 server provides a unique platform to support the accelerated performance of GPUs with a physical design intended to facilitate airflow and reduce overheating. At Principled Technologies, we first compared the floating-point performance of an Intel processor-powered dell PowerEdge C4130 without any GPUs (baseline) and then with the maximum amount of NVIDIA Tesla K80 GPU accelerators (maximum) in three different Intel Xeon processor configurations: pairs of E5-2650 v3, E5-2670 v3, and E5-2690 v3 processors.
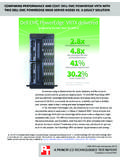
2 We found that adding the four GPUs to the dell PowerEdge C4130 delivered up to times more performance than the dell PowerEdge C4130 without any GPUs. Improved performance from GPUs means getting more from HPC workloads. We then compared the performance of the dell PowerEdge C4130 with four GPUs against a Supermicro 1028GR-TR with the maximum amount of NVIDIA Tesla K80 GPUs (three) in all three processor configurations. We found that the dell PowerEdge A Principled Technologies test report 2 dell PowerEdge C4130 & NVIDIA Tesla K80 GPU accelerators C4130 consistently outperformed the Supermicro server solution, delivering up to 28 percent better performance. In addition, when we looked at GPU temperatures as an indicator of airflow through both the dell and Supermicro servers, we found the GPU temperatures of the dell PowerEdge C4130 were up to 13 degrees (Celsius) cooler than the Supermicro 1028GR-TR. These cooler running temperatures may help prevent deterioration of the silicon from overheating and may extend the lifetime of the chips.
3 For more information about the testing components, see Appendix A. For more information on the system configuration of each server, see Appendix B. For detailed steps on how we tested, see Appendix C. GET MORE COMPUTING POWER WITH NVIDIA Tesla K80 GPUS Organizations running HPC applications specialize in areas ranging from molecular dynamics to animation to weather forecasting. In recent years, the addition of GPUs to servers has seen increased performance for these organizations. The GPUs add computational power, which can offload or supplement the workload on the CPU. We used Intel s version of the high-performance LINPACK (Intel HPL) benchmark to test the floating-point performance of the baseline configuration without any NVIDIA GPUs. We used NVIDIA s version of the high-performance LINPACK ( NVIDIA HPL) benchmark to test the floating-point performance of the maximum configuration, which aggregates all available compute power of both GPUs and CPUs.
4 Our tests measured CPU performance for the baseline configuration and GPU and CPU performance combined for the maximum configuration. The HPL benchmark solves a set of linear equations and returns the time required and the average floating point performance achieved in giga-floating-point operations per second (Gflops). In our tests, we chose a problem size of 121,344 and a block size of 1,024 to make full use of the memory and to maximize performance. Our testing occurred in a datacenter at 25 degrees Celsius. We first tested the baseline configuration of the PowerEdge C4130 in three different processors. Having three processor configurations allowed us to see how changes in processor affected the floating-point performance. Next, we tested the maximum configuration of the PowerEdge C4130 in the same three Intel Xeon processor configurations. Figure 1 presents information for each Intel Xeon processor we used. Intel Xeon processor E5-2650 v3 Intel Xeon processor E5-2670 v3 Intel Xeon processor E5-2690 v3 TDP (watts) 105 120 135 Frequency (GHz) Cores 10 12 12 Figure 1: CPU information for the processors we used in testing.
5 A Principled Technologies test report 3 dell PowerEdge C4130 & NVIDIA Tesla K80 GPU accelerators Our tests showed that adding GPUs to each processor configuration could dramatically increase floating-point performance. Figure 2 provides the normalized Gflops performance numbers for baseline and maximum GPU configurations for each processor. The dell PowerEdge C4130 maximum GPU configuration delivered times, times, and times more floating-point performance than the baseline configuration with Intel Xeon processors E5-2650 v3, E5-2670 v3, and E5-2690 v3, respectively. Figure 2: Normalized LINPACK floating-point performance for the baseline and maximum configuration of the PowerEdge C4130 using multiple Intel Xeon processor configurations. Higher numbers are better. This increase in compute power can put servers in a dangerous position. Running too long at higher-than-normal temperatures can diminish workload performance for these HPC applications and can decrease hardware life.
6 The design of the dell PowerEdge C4130 positions the GPUs to receive significant airflow for cooling. In addition, the design includes more openings that allow air to move out of the server, helping air warmed by GPUs and processors to leave. We found that peak GPU temperatures for the dell PowerEdge C4130 maximum configuration were generally consistent with each of the three Intel Xeon processors (see Figure 3). All three maximum GPU temperatures were within a standard safe-operation temperature 1 NVIDIA GPUs typically have maximum operating temperatures of approximately 105 C. ~/ NVIDIA -gpu-maximum-operating-temperatu re-and-overheating A Principled Technologies test report 4 dell PowerEdge C4130 & NVIDIA Tesla K80 GPU accelerators Figure 3: Peak GPU temperature for the maximum configurations of the dell PowerEdge C4130 with each of the three Intel Xeon processors.
7 If your organization needs the power of GPUs to run graphic-heavy design applications or complex scientific simulations, the dell PowerEdge C4130 can provide the hardware to support your demanding workloads. Keeping the silicon of GPUs at a reasonable temperature, as the PowerEdge C4130 did, could extend the lifetime of the chips, while reducing diminished performance and power inefficiency. BETTER PERFORMANCE FROM THE dell PowerEdge C4130 WITH COOLER NVIDIA Tesla K80 GPUS After realizing the performance benefits of adding NVIDIA Tesla K80 GPU accelerators to the dell PowerEdge C4130 , we compared the maximum configuration of the PowerEdge C4130 to a Supermicro 1028GR-TR server with the maximum number of supported NVIDIA Tesla K80 GPU accelerators in the three Intel Xeon processor configurations. The PowerEdge C4130 can house four NVIDIA Tesla K80 GPU accelerators simultaneously, while the Supermicro 1028GR-TR can hold only three.
8 Not only did the dell PowerEdge C4130 maximum configuration outperform the Supermicro 1028GR-TR maximum configuration, but it also kept the GPU temperatures cooler for all three processors. Figure 4 shows GPU temperatures for both solutions in each processor configuration. A Principled Technologies test report 5 dell PowerEdge C4130 & NVIDIA Tesla K80 GPU accelerators Figure 4: GPU and CPU placement in the two servers we tested showing sensor temperatures with multiple Intel Xeon processor configurations. A Principled Technologies test report 6 dell PowerEdge C4130 & NVIDIA Tesla K80 GPU accelerators In the following sections, we show how the maximum configurations for each solution performed in each of the processor configurations we tested. Intel Xeon processor E5-2650 v3 Floating-point performance We found that the dell PowerEdge C4130 maximum configuration achieved 25 percent greater floating-point performance than the Supermicro 1028GR-TR maximum configuration.
9 Figure 5 shows the normalized Gflops achieved by the two solutions with Intel Xeon processors E5-2650 v3. Figure 5: Normalized LINPACK floating-point performance for the maximum configuration of each system. Higher numbers are better. GPU temperature We found the peak GPU temperature for the dell PowerEdge C4130 maximum configuration was 9 degrees cooler than the peak GPU temperature of the Supermicro 1028GR-TR (see Figure 6). Figure 6: Peak GPU temperature for the maximum configuration of both systems. Lower numbers are better. A Principled Technologies test report 7 dell PowerEdge C4130 & NVIDIA Tesla K80 GPU accelerators Intel Xeon processor E5-2670 v3 Floating-point performance We found that the dell PowerEdge C4130 maximum configuration achieved 28 percent greater floating-point performance than the Supermicro 1028GR-TR maximum configuration. Figure 7 shows the normalized Gflops achieved by the two solutions with Intel Xeon processors E5-2670 v3.
10 Figure 7: Normalized LINPACK floating-point performance for the maximum configurations of each system. Higher numbers are better. GPU temperature For the maximum configuration, the peak GPU temperature of the dell PowerEdge C4130 was 13 degrees cooler than the Supermicro 1028GR-TR solution (see Figure 8). Figure 8: Peak GPU temperature for the maximum configuration of both systems. Lower numbers are better. A Principled Technologies test report 8 dell PowerEdge C4130 & NVIDIA Tesla K80 GPU accelerators Intel Xeon processor E5-2690 v3 Floating-point performance We found that the dell PowerEdge C4130 maximum configuration achieved 27 percent greater floating-point performance than the Supermicro 1028GR-TR maximum configuration. Figure 9 shows the normalized Gflops achieved by the two configurations with Intel Xeon processors E5-2690 v3. Figure 9: Normalized LINPACK floating-point performance for the maximum configurations of each system.