Transcription of Determination of water hardness from common water sources ...
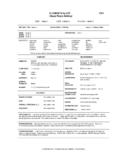
1 Concordia College Journal of Analytical Chemistry 1 (2010), 4-8 4 Determination of water hardness from common water sources using flame atomic absorbance spectrometry Jarryd Campbell and Dan Peterson Department of Chemistry, Concordia College, 901 8th St S, Moorhead, MN 56562 Abstract water hardness is determined by the total concentration of magnesium and calcium. The hardness of a water source has important economic and environmental implications. Currently, titration methods are the most common protocol for the Determination of water hardness , but investigation of instrumental techniques can improve efficiency. In this study the hardness of river water , tap water , and drinking water were determined by measuring the concentration of calcium and magnesium using flame atomic absorbance spectroscopy. River water samples were found to contain nearly three times the concentration of each element as compared to both tap and drinking water .
2 water hardness from drinking water appears to not be significantly different than tap water . atomic absorbance is a fast, efficient way to determine water hardness and is an effective alternative to traditional titration methods. Introduction water hardness is determined by measuring the total concentration of magnesium and calcium in a water source. water hardness impacts ecological, economic, and human health concerns. Ecologically, water hardness impacts fish cultures as well as many other species that rely on a steady calcium carbonate Hard water in the municipal water supply also raises economic issues as a considerable amount of money is spent yearly to ensure that water is softened (minerals are removed) to avoid its negative impacts such as degrading soaps and precipitate deposition on faucets. Health questions regarding drinking hard water have also begun to emerge.
3 The World Health Organization states that hard water may lead to cardiovascular disease, although the there have not been enough studies for this finding to be For all of these concerns, a reliable way to measure water hardness is necessary. water hardness is reported as the concentration of carbonates in parts per million (ppm), using calcium carbonate as a generalized concentration that encompasses all divalent cations in the sample. Table 1 shows how CaCO3 concentrations affect the overall hardness of a water Magnesium and calcium concentrations (the most abundant in water ) are used to calculate water hardness by the formula: [CaCO3]total = [Ca] + [Mg].3 Table 1. water hardness chart Concentration as CaCO3 Indication 0 to 60 ppm Soft water 60 to 120 ppm Moderately hard water 120 to 180 ppm Hard water >180 ppm Very hard water Concordia College Journal of Analytical Chemistry 1 (2010), 4-8 5 Currently, EDTA titrations are among the most commonly used techniques to quantify water hardness .
4 This method relies on precise volumetric measurements and a lot of human intervention, which slows down the procedure and limits efficiency. For this experiment we measured the calcium and magnesium concentrations by using a fast and efficient instrumental technique to eliminate these concerns, flame atomic absorbance spectroscopy (AA). AA is a powerful instrument which measures the concentration of individual elements in a sample. The sample is introduced to an open flame that breaks everything into its basic atomic components. Light with a specific wavelength that is able to be absorbed by the atom of interest is sent through the sample and its absorbance is measured and quantified. AA is simple to operate and generates data very quickly and accurately with minimal intervention. The aim of this experiment was to quantify the water hardness from three different sources : the Red River, tap water , and drinking fountain water .
5 The procedure for determining the concentration of calcium and magnesium from a water sample using AA was taken from the Environmental Protection ,5 It was expected that the hardness of the Red River should be significantly higher than the others as it was untreated. However, the recent flood of the Red River has raised concern about an increased mineral concentration in the river, as well as in the tap and drinking water . A comparison of water hardness now versus the pre-flood environment will provide useful information about the nature of flooding. The difference between the tap water and the drinking fountain water hardness was also examined to determine whether or not they come from the same source and if the drinking fountain water is softened more than the tap water . Moreover, the calibration curves from the software are often assumed to give accurate results without testing.
6 In response the accuracy of the calibration curves generated by the Varian software was investigated by plotting the same curve in Microsoft Excel and generating a curve-of-best-fit. EXPERIMENTAL Prior to standard/sample preparation a lanthanum chloride solution was made by dissolving a sample of LaCl3 (Fischer Sci.) in 250 mL conc. HCl in small increments (caution: reaction is violent) and diluting to 500 mL with deionized water . The lanthanum chloride solution was added to each sample to mask the effects of anions in the solution. A 2% HNO3 solution was also made by adding 10 mL conc. HNO3 to a 1-L volumetric flask containing 700 mL deionized distilled water , mixing, and diluting to the mark. Standard Preparation A magnesium standard solution (500 ppm) was made by dissolving g MgO (Acros) in 10 mL 2% HNO3 (note: 10 mL conc. HNO3 was added to dissolve MgO completely) and diluted to 1 L in a volumetric flask.
7 Concentrations of , , , and ppm were made for the magnesium calibration curve by diluting the magnesium standard solution with 2% HNO3. For the calcium standard curve, concentrations of , , , and ppm were made by diluting the calcium standard solution (1000 ppm, Fischer S ci.) with 2% HNO3. Concordia College Journal of Analytical Chemistry 1 (2010), 4-8 6 Sample Preparation water samples from the Red River, tap water , and drinking water was analyzed. water from the Red River was collected from Woodlawn Park and stored using a 2-L glass basin. A 200-mL aliquot of the sample was filtered through a m membrane filter. A 25-mL aliquot of the filtrate was acidified with 22 mL 2% HNO3 and 3 mL LaCl3 solution. Further dilutions of 10:1 and 50:1 were made for AA analysis. Tap water was collected from a men s restroom in Ivers Hall on the Concordia College campus and drinking water was taken from a drinking fountain in Ivers as well.
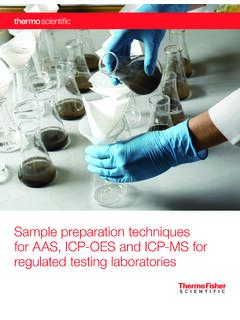
8 Acidification and the addition of the LaCl3 solution were done in a similar manner as the Red River samples, as were dilutions. Instrumentation atomic absorption measurements were carried out using a Varian AA240 spectrometer with a Mg/Ca hollow cathode lamp light source (7 mA lamp current). Atomization was performed using an air/acetylene flame . The instrument was zeroed with 2% HNO3 and rinsed between each collection with deionized water . Magnesium absorbance was measured at nm, and calcium absorbance was measured at nm. Calibration curves for magnesium/calcium were generated using the previously described standard solutions. Sample data was collected directly after each respecti ve calibration curve was obtained. Results and Discussion Calibration Calibration curves were constructed by plotting absorbance versus calcium and magnesium concentrations, respectively (Fig.)
9 1). Concentrations of the standards used to create the calibration curves were determined by recommendations given in the Varian software. The plots are non-linear and rely on the software to generate sample concentrations based on the measured absorbance. Creating a replicate curve on Microsoft Excel gives a different non-linear equation and yields results that vary slightly from those calculated by the software as shown in Table 2. The Excel equation for calcium gives concentrations that range from to higher than the Varian Data. The recalculated magnesium concentration was also different at to percent lower. These small differences are likely due to slight variations in how each software best fits the line. The Varian software uses a new rational line fit to generate the curves, while Microsoft Excel was limited to a second-order polynomial fit.
10 Also, the Excel equations were only carried out to four decimal places. Increasing this number may ultimately help bring the two calculations closer together. Table 2. Excel Calculation Differences [Calcium] [Magnesium] Source Percent Difference Source Percent Difference River River Tap Tap Fountain Fountain Concordia College Journal of Analytical Chemistry 1 (2010), 4-8 7 Figure 1. Calibration curves of calcium and magnesium (from left to right) were generated using Microsoft Excel atomic absorption data analysis The average, standard deviation, and percent relative standard deviation (%RSD) of the magnesium and calcium concentrations from each source was determined by pooling all dilutions and trials (Table 3). As expected, the sample collected from the Red River had the highest concentrations of both magnesium and calcium with around three times the concentration compared to the other two sources .