Transcription of Determining appropriate inventory levels is one of the ...
1 APICS magazine | July/August 2011 33 Safety stock simply is inventory that is carried to prevent stockouts. Stockouts stem from factors such as fluctuating customer demand, forecast inaccuracy, and variability in lead times for raw materials or manufacturing. Some operations managers use gut feelings or hunches to set safety stock levels , while others base them on a portion of cycle stock level 10 or 20 percent, for example. While easy to execute, such techniques generally result in poor performance. A sound, math-ematical approach to safety stock will not only justify the required inventory levels to business leaders, but also balance the conflicting goals of maximizing customer service and minimizing inventory cost.
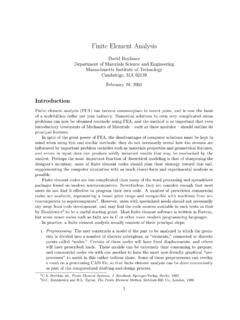
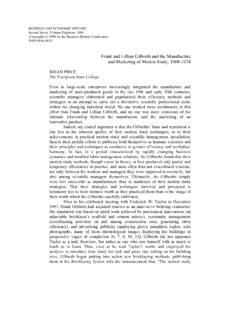
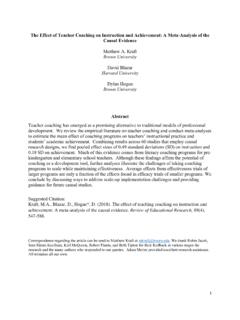
2 Safety stock determinations are not intended to eliminate all stockouts just the majority of them. For example, when designing for a 95 percent service level, expect that 50 percent of the time, not all cycle stock will be depleted and safety stock will not be needed. For another 45 percent of cycles, the safety stock will suffice. But in approximately 5 percent of replenishment cycles, expect a stockout. (See Figure 1.)While designing for a higher service level say, 98 percent would result in fewer stockouts, this requires significantly more safety stock. There must be a balance between inventory costs and custom-er service.
3 By using the methods and equations that follow, you can find safety stock levels to achieve your desired customer service in demand Imagine the only variability you need to protect against is demand variability, and good historical data are available. The safety stock needed to give a certain level of protection simply is the standard deviation of demand variability multiplied by the Z-score a statistical figure also known as standard score. For example, to satisfy demand with a 95 percent confidence level, according to statistical analysis, it s necessary to carry extra By Peter L.
4 King, CSCPD etermining appropriate inventory levels is one of the most important and most challenging tasks faced by operations managers. If you carry too much inventory , you tie up money in working capital; if you don t carry enough inventory , you face stockouts. Fortunately, the cycle stock portion of the inventory equation is straightforward. What keeps people up at night is safety CoDeCraCKUnderstanding safety stock and mastering its equationsSafety stockCycle stock50% of cycles45% of cycles5% of cyclesFIgure 1: inventory designed for a 95 percent service level34 July/August 2011 | APICS magazine Desired cycle service equal to standard deviations of demand variability.
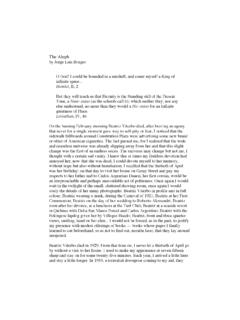
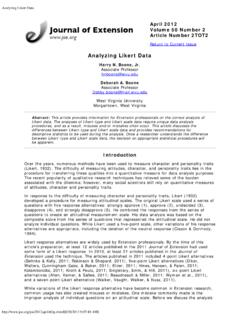
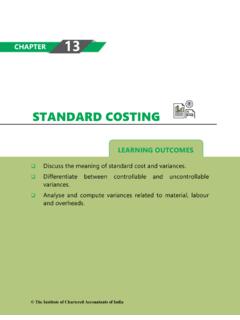
5 This is equivalent to a Z-score of To further understand Z-score, imagine that no safety stock is carried. In this situation, the Z-score is zero. even so, there will be enough inventory to meet demand in 50 percent of cycles. If Z-score equals 1, the safety stock will protect against one standard deviation ; there will be enough inventory 84 percent of the time. This percentage of cycles where safety stock prevents stockouts is called the cycle service level. Figure 2 shows the relationship of desired cycle service levels to Z-score. As illustrated, the relationship is nonlinear: higher cycle service levels require disproportionally higher Z-scores and, thus, disproportionately higher safety stock levels .
6 Typical goals fall between 90 and 98 percent, and statistically speaking a cycle service level of 100 percent is than using a fixed Z-score for all products, set the Z-score independently for groups of products based on criteria such as strategic importance, profit margin, or dollar volume. Then, those stockkeeping units with greater value to the business will have more safety stock, and vice far, it has been assumed that the demand periods equal total lead time, including any review period. When this is not the case, instead, calculate standard deviation based on periods equal to the lead time.
7 For example, if the standard deviation of demand is calculated from weekly demand data and the total lead time including review period is three weeks, the standard deviation of demand is the weekly standard deviation times the square root of the ratio of the time units, or 3. Taking all this into consideration, the safety stock equation becomes:, where:Z = Z-score PC = performance cycle, another term for total lead time T1 = time increment used for calculating standard deviation of demand D = standard deviation of performance cycle includes the time needed to perform functions such as deciding what to order or produce, communicating orders to the supplier, manufacturing and processing, and delivery and storage, as well as any additional time required to return to the start of the next cycle.
8 Variability in lead time In the previous equation, safety stock is used to mitigate demand variability. however, when variability in lead time is the primary concern, the safety stock equation becomes:, where: LT=standard deviation of lead time Davg= average both demand variability and lead time variability are present, statistical calculations can combine to give a lower total safety stock than the sum of the two individual calculations. In cases where demand and lead time variability are independent that is, they are influenced by different factors and both are normally distributed, the combined safety stock equation becomes:In other words, the safety stock is Z-score times the square root of the sum of the squares of the individual when demand and lead time variability are not independent of each other, this equation can t be used.
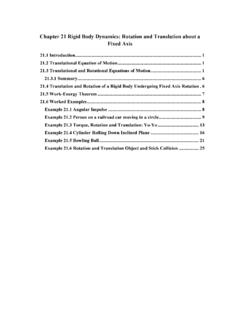
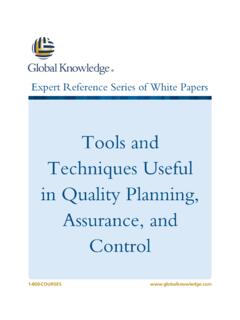
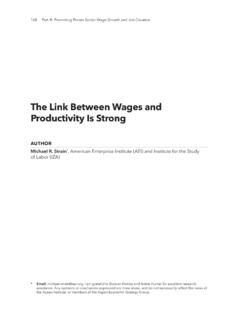
9 In these cases, safety stock is the sum of the two individual calculations: Safety stock = (Z PCT1 D)+ (Z LT Davg) Cycle service level and fill rate The previous equations are useful for predicting the safety stock needed to attain a certain cycle service level a percentage of replenishment cycles. Sometimes, business leaders instead wish to control the amount of volume ordered that is available to satisfy customer demand a quantity known as fill rate. Fill rate often is a better measure of inventory performance, as cycle service level merely indicates the frequency of stockouts without regard to their magnitudes.
10 (See Figure 3.) FIgure 2: relationship between desired service level and Z-scoreSafety stock determinations are not intended to eliminate all stockouts just the majority of service levelSafety stock = (Z PCT1/) + ( Z LT Davg) D Safety stock = Z PCT1/ D2 ) + ( LT Davg)2 (Safety stock = Z PCT1/ D Safety stock = Z LT DavgAPICS magazine | July/August 2011 35 As illustrated in Figure 3, when supply and demand are relatively stable that is, when standard deviations of demand and lead time are low fill rate will tend to be higher than cycle service level.