Transcription of Direct comparison of two Cryocooled Sapphire …
1 Direct comparison of two Cryocooled Sapphire oscillators presenting relative frequency instability at 10 15. S. Grop , B. Dubois , Masson , Bourgeois , Y. Kersal e , E. Rubiola , G. Haye . FEMTO-ST. and V. Giordano . Institute, Time and Frequency Dpt., 32 av. de L'Observatoire, 25044 Besanc on Cedex, France ULISS ST, SAIC Universit e de Franche-Comt e, T emis Sciences, 25000 Besanc on Cedex, France Abstract In this paper we present the Direct comparison of A. Schematic architecture of the Cryocooled Sapphire Oscil- two microwave Cryocooled Sapphire oscillators demonstrating lator Instruments a relative frequency stability better than 2 10 15 at short term and of the order of 1 10 14 over one day integration.
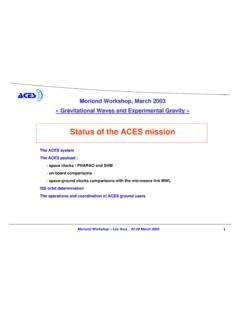
2 We The architecture of a Cryocooled Sapphire Oscillator Instru- also report the frequency stability evaluation of a microwave ment is represented in the figure 1. signal generated from a planar waveguide external cavity laser (PW-ECL) referenced to a Fabry-Perot cavity through optical-to- Ultra-stable oscillator ULISS and Elisa CSO freq. microwave frequency division with a commercial Er:fiber optical frequency comb owned by the laboratoire temps-fr equence Cryogenic Sapphire 10 GHz (LTF) of the university of Neuch atel, Switzerland, and the phase Oscillator (CSO): noise measurement of the engineering model of the Pharao clock ultra-stable and autonomous Frequency synthesis frequency synthesis owned by the Centre National d'Etudes frequency source 100 MHz Spatiales (CNES) at Toulouse, France.
3 These lastest results were obtained by moving one of our Cryogenic Sapphire Oscillator 5 MHz lock to HM. (CSO) from the FEMTO-ST Institute to these two metrological t > 1000s sites. 100 MHz binary Monitoring and Control word PCO. I. I NTRODUCTION 100 MHz input We recently developped a Cryogenic Sapphire Oscillator Fig. 1. Schematic architecture of a Cryocooled Sapphire Oscillator Instru- (CSO) named Elisa presenting a short term frequency stability ment better than 3 10 15 for 1 s 1000 s and achieving 10 15 for one day integration [1], [2].
4 This CSO was The CSO design and its characterization were already designed and built in the framework of a research contract described in the references [1], [2], [5] [7]. funded by the European Space Agency (ESA). It incorporates a pulse-tube cryocooler instead of a bath cryostat, thus eliminat- II. ULISS FREQUENCY STABILITY CHARACTERIZATION. ing the need for regular supplies and manual refilling of liquid ULISS unit is a copy of the first unit Elisa and was finalized helium. The advent of reliable and Cryocooled CSO open the the 11th November 2011.
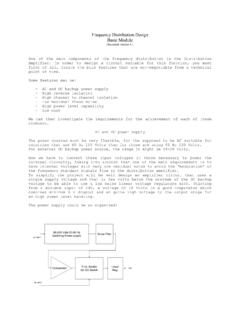
5 The two CSO outputs were mixed possibility to implement such an ultra-stable reference not only to generate a beatnote at 750kHz. This beatnote was directly in metrological laboratories with liquid helium facilities but counted on an Agilent 53132A -counter parametrized with also in remote sites like base stations for space navigation, a gate time = 1 s [8], [9]. After approximately 4 days VBLI antenna sites, .. [3], [4] of acquisition, the relative frequency deviation ( ) was In our project ULISS (Ultra Low Instability Signal Source), calculated for the different integration times by grouping funded by Regional and European Institutions, we built a new the 1 s data.
6 The first significant result was measured the Cryocooled oscillator named ULISS specially designed to be 12th December 2011, the time to tune the different servo transportable. The ULISS oscillator was already used to qual- control loops. The result is given in the figure 2. No data post- ify with success a high stability frequency source located at processing has been done: no abnormal point suppression nor Neuch atel, Switzerland, and the PHARAO frequency synthesis drift removing. Toulouse, France. ULISS was specially moved from FEMTO- We measured a relative frequency stability ( ) better than ST for the measurement compaigns.
7 2 10 15 for integration times 1 s 200 s. For longer In this paper we present the frequency stability characteriza- integration times, we observed a hump around 2000 s, that we tion of the newly built CSO demonstrating the reproductibility still have to determined the source, and a drift of 1 10 14 /day. of our technology and we summarize the main results obtained The second curve of the figure 2 is the relative frequency at the LTF and CNES. deviation calculated from a quiet selected time period of about acquisition time: 319793s (app.)
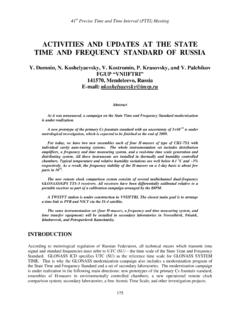
8 4 days) 7000s (app. 2 hours) optical 1e-14. frequency source femtosecond laser relative frequency instability frequency comb ( ) 2 units s GHz 1e-15. A. y ( ) 1 unit ULISS 0 dBm GHz 10 dBm A. 1e-16. 1 10 100 1000 10000 100000. integration time (s) MHz 188 KHz Fig. 2. relative frequency stability of the GHz CSO outputs frequency counter 7000 s extracted from the complete set of data. The calculated Fig. 3. comparison set-up standard deviation corresponds to a flicker floor, its value does not depends on.
9 This flicker floor comes from the USO internal noise sources. As the two CSOs operate at a The beam of the stabilized femtosecond laser was sent different frequency, we assume that these noise sources are to a large bandwidth photodiode. The output signal of the decorrelated. In that case and if the two CSOs are assumed photodiode is filtered to keep the 40th harmonic of the identical, it is justified to divide the result by 2 to obtain femtosecond laser repetition rate, amplified and mixed with the the frequency stability of one unit.
10 Moreover the reference amplified GHz ultra-stable signal generated by ULISS. [9] gives the correspondance between ( ) and the true The resulting beatnote at 188 kHz was counted to evaluate Allan deviation y ( ). For white frequency of flicker frequency the frequency stability. The measurement result is shown in noise: ( ) y ( ). The open squares in the figure the figure 4. 2 represent y ( ) evaluated taking into account these two corrections. The flicker floor of one unit is thus: y ( ) = 4 10 16 for 30 s 500 s (1).