Transcription of Directional Options Trading - Cboe Options …
1 Directional Options Trading Strategy And Position Management Bill Looney cboe Global Business Development Oleg Lugovkin Volatility PM Argentiere Capital 3rd Annual cboe Risk Management Conference Europe Copyright 2014 cboe . All rights reserved 2 Introduction OBJECTIVES Emphasize/Maintain a Directional Mindset Review Quantitative Factors Review Trade Examples/Scenarios Discuss Structuring and Risk Management Open Discussion and Questions Copyright 2014 cboe . All rights reserved 3 What Is Directional Trading ? Directional Trading Strategies: Utilize Options to express a view or opinion on potential stock movement Focus on achieving leverage through proper Delta selection Analyze Key Quantitative Factors to Determine the Best Strategy to Utilize The Directional Trading Process is: Define View Structure (Hard) Risk Manage (Art) Copyright 2014 cboe . All rights reserved 4 Directional Traders Mindset/Objective Hedging Speculative Yield Directional Trading seeks to achieve one of the above goals Option strategies can fall under different goals Directional Traders remain OPEN to exploring ALL possible strategies When Trading directionally, it is REQUIRED to define the goal in advance Copyright 2014 cboe .
2 All rights reserved 5 Facts and Stats from the Sell-Side For 2014, Directional Trading Strategies Dominate Desk Flows United States Equity Markets Participants Are Bottoms Up Investing Directional Strategies Are Not just for Hedge Funds Between 75% to 85% Of Flows are Single Stock Related Most Popular Strategies Are: M&A Based Strategies Term Structure Trades Reversal/Conversions Directional Long/Short and Stock Substitutes Strategies Upside Calls Yield Generation Short Put Sales outsize Active Overwriting Directional Trading Trends Copyright 2014 cboe . All rights reserved 6 Quantitative Factors Implied Volatility (Vega) Volatility is a measure of price variation over time The markets attempt to anticipate the anticipation Implied volatility is forward-looking (the market s estimate of future volatility) Historical volatility is calculated from known price behavior in the past Copyright 2014 cboe . All rights reserved 7 Quantitative Factors SKEW Difference between implied volatility levels at different strike prices Defines the curve of volatility Serves as a gauge for determining possible risk scenarios and market positioning Helps Directional traders analyze different Trading strategies Copyright 2014 cboe .
3 All rights reserved 8 Quantitative Factors GAMMA The rate of change in delta with respect to the underlying price Mathematically, gamma is the second derivative of an Options value with respect to underlying price Used to gauge the price movement of an option, relative to the amount it is in or out of the money. (Change in DELTA) Largest for at-the-money Options Copyright 2014 cboe . All rights reserved 9 Quantitative Factors THETA A measure of the rate of decline in the value of an option due to the passage of time. (Time Decay) The measure of theta quantifies the risk that time imposes on Options as Options are only exercisable for a certain period of time Time has importance for option traders on a conceptual level more than a practical one, so theta is not often used by traders in formulating the value of an option Copyright 2014 cboe . All rights reserved 10 Quantitative Factors And Momentum Names Facebook and GOGO Facebook (FB) - Earnings Date Change Accounts utilized WEEKLY Options to: Take Advantage of Shift in Volatility Change Strike Exposure GOGO Inc.
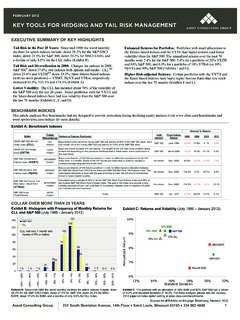
4 (GOGO) High Implied Volatility Alternative Accounts Sought Long Exposure Into Earnings Took Advantage of Cheaper Longer Dated ITM Volatility Purchased Higher Delta Options Achieving Intrinsic Value Achieved Lower Theta and Gained Time 11 Why Use Options for Directional Trading ? To create leverage through optionality To limit downside To express views on timing or Trading ranges The lower the volatility, the higher the leverage you get from using optionality 0%100%200%300%400%500%600%700%70%75%80%8 5%90%95%100%105%110%115%120%125%130%Appl e price Apple Sep14 ATM straddle value at 15 and 30 vol PNL 15 VOLPNL 30 VOL12 Implied Volatility Is Key Driver of Option Prices Major drivers of option pricing: Implied Volatility Maturity Implied Volatility will tell you if the option is cheap or expensive and if it provides you with high leverage Options can be compared to insurance premium premium goes up as uncertainty increases Rates Dividends 13 How to Evaluate Implied Volatility?
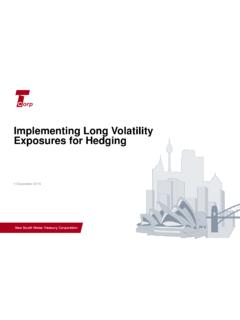
5 Implied vs Realized the basics of the volatility Spread/Peer Analysis - FX effect EU vs US, XOM vs CVX, JPY vs NKY Cap Structure Analysis is credit telling us something else? Event Risk are earnings / large catalyst mispriced? Correlation Analysis are components or benchmark cheaper? Imbalances between supply and demand of volatility create inefficiencies such as skews and term structures Can be used to enhance risk reward profile of Directional trades! 14 Supply / Demand Opportunities Term Structure vs US Term Structure SPXNKY10%12%14%16%18%20%22%24%7580859095 1001051101151201251 Year Skew slope Asia vs US SPXNKYSkew Demand for US long-term protection Short-term call overwriting in US Supply of puts in Asia for yield enhancement purposes Demand for calls in Asia from Macro and Retail SPX NKY 1M 3M 6M 9M 1Y 2Y 90-100% skew S&P500 and Nikkei225 by maturity 15 Exploiting Term Structure and Skew Inefficiencies Trade example 1: Leverage on upside convexity Options Quick Pricer PriceMarketMaturityStrikeStrike% C/P A/EAmountNotional, $VolPriceprice %spx , ,000106,975, , ,000-10,610, 10 by 1: 6 weeks to maturity PNL %Idea: benefit from a broad based rally take advantage of structural inefficiencies Structure: buy 10x SPX calls vs 1x NKY/RTY/.
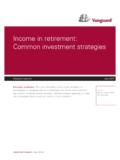
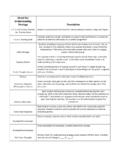
6 Flat premium 10x leverage Risk Management: diversify short leg don t hold to maturity, take profit or roll 16 Exploiting Term Structure and Skew Inefficiencies Trade example 2: Outperformance Asia over US Idea: NKY outperformance over SPX on upside Structure: Jun15 102%-114% call spread switch Premium flat Risk Management: Requires consistent monitoring Needs to be rolled or taken off when targets are met Options Quick Pricer PriceMarketMaturityStrikeStrike% C/P A/EAmountNotional, $VolPriceprice %nky , ,000-100,039, , ,000100,039, , ,500100,167, , ,500-100,167, Exploiting Skew Inefficiencies Trade example 3: SPX calls vs puts Idea: Long market Use skew inefficiencies to reduce downside Structure: 6 week 12x 105% call vs 1x 95% put Costless Options Quick Pricer PriceMarketMaturityStrikeStrike% C/P A/EAmountNotional, $VolPriceprice %spx , ,000120,280, , ,000-9,700, price MTM value Option strategyFutures18 Exploiting Vol of Vol premiums Trade example 4: Downside protection / hedging Idea: Buy downside protection Structure: VIX wings bid for crash protection VIX expired only 4x below 12 since 06 Avoid the roll down on the futures Buy 17/23 Sep14 Call spread vs 12 Put Costless 507090110101112131415171921232527 Implied vol Strike VIX Skew Sep-14 VIX SKEWRisk Management: protection from 17 23 Roll the structure to higher strikes once ITM Buy back 12 put when worthless -4-2024681011121314151617181920212223242 526 Pay off VIX Settlement Pay off19 The Magic of Low Volatility Trade example 5: Contrarian trade on Silver Idea.
7 Get long Silver after a 60% correction Benefit from vol at a 8 year low Benefit from any upside rally or shock (rerating of vol levels) Structure: Simply buy Jan16 ATM call is Trading at 2 USD Pay hardly no decay (long-dated) 2014 Tradelegs LLC. All rights reserved. Tradelegs Confidential Tradelegs 20 20 Tradelegs Derivative Strategist Specialized Technology for Real-World Complexity Generate the optimal option strategy given your underlying prediction Apply constraints such as capital, risk, margin, net cash Tradelegs checks every combination of put, call, expiration and equity .. in every quantity, long or short .. over all potential prices, volatilities and changing liquidity .. a combinatorial explosion of approximately 3x1030 combinations Equivalent to searching for the finest grain of sand on every beach of 400 billion earths! Tradelegs patent-pending technology Specialized algorithm hybridization infrastructure Cloud-based cluster-compute processing Benefits Algorithmically complete: subject to your requirements and market data, it can generate the optimal custom strategy, or else prove to you that no viable trade exists Flexible: quickly layer on the additional constraints as you see fit, letting you easily shape the strategy to match your precise needs Accurate and realistic: represents real-world Options Trading and its uncertainties without the risks inherent in oversimplification 2014 Tradelegs LLC.
8 All rights reserved. Tradelegs Confidential Tradelegs 21 21 Optimize the Trade-off between Risk and Reward Gain edge Unlock the power of custom strategies Hedge positions and control worst-case loss Reduce volatility of your returns Achieve structured derivatives results using listed products Maximize expected returns Shape returns on your fundamental equity research with scientifically optimized, custom Options strategies Visit the cboe booth during the conference or see for more information THANK YOU cboe Global Business Development 400 South LaSalle Street Chicago, Illinois 60605 312-786-8310 Copyright 2014 cboe . All rights reserved 23 cboe Disclosures Options involve risk and are not suitable for all investors. Prior to buying or selling an option, a person must receive a copy of Characteristics and Risks of Standardized Options . Copies are available from your broker, by calling 1-888- Options , or from The Options Clearing Corporation at The information in this presentation is provided solely for general education and information purposes.
9 No statement within the presentation should be construed as a recommendation to buy or sell a security or to provide investment advice. Any strategies discussed, including examples using actual securities and price data, are strictly for illustrative and educational purposes. In order to simplify the computations, commissions, fees, margin interest and taxes have not been included in the examples used in this presentation. Such costs will impact the outcome of the stock and Options transactions and should be considered. Investors should consult their tax advisor as to how taxes affect the outcome of contemplated Options transactions. Supporting documentation for any claims, statistics, or other technical data is available from cboe or Argentiere Capital upon request. Chicago Board Options Exchange, Incorporated ( cboe ) is not affiliated with Argentiere Capital. This presentation should not be construed as an endorsement or an indication by cboe of the value of any non- cboe product or service described in this presentation.
10 cboe , Chicago Board Options Exchange , Execute Success and VIX are registered trademarks and SPX is a service mark of cboe . Standard & Poor's , S&P and S&P 500 are registered trademarks of Standard & Poor's Financial Services, LLC and have been licensed for use by cboe . Financial products based on S&P indices are not sponsored, endorsed, sold or promoted by Standard & Poor s, and Standard & Poor s makes no representation regarding the advisability of investing in such products. All other trademarks and service marks are the property of their respective owners. 24 Disclosures This presentation has been prepared in conjunction with Argenti re Capital solely for the purpose of providing background information to the person to whom it has been delivered. The information contained herein is strictly confidential and is only for the use of the person to whom it is sent and/or who attends any associated presentation. The information contained herein may not be reproduced, distributed or published by any recipient for any purpose without the prior written consent of Argenti re Capital.