Transcription of DNA Integrity Number (DIN) with the Agilent 2200 ...
1 DNA Integrity Number (DIN) with the Agilent 2200 TapeStation System and the Agilent Genomic DNA ScreenTape AssayTechnical OverviewAuthorsMarcus Gassmann Agilent Technologies, Waldbronn, GermanyBarry McHoullAgilent Technologies, Inc. Edinburgh, UKIntroductionThe results of numerous molecular screening and assay methods often rely on the overall quality of the genomic DNA (gDNA) input material. For example, array comparative genome hybridization (aCGH) and Next Generation Sequencing (NGS) can require intact, high quality gDNA to ensure high quality , unambiguous results. It is highly recommended to perform a quality control (QC) of the input material for these workfl ows, especially costly procedures such as NGS, as it saves both wasted time and effort on low quality Agilent 2200 TapeStation system, in conjunction with the Agilent Genomic DNA ScreenTape assay, provides an excellent solution for assessing the quantity and Integrity of the gDNA starting material.
2 However, to provide a more direct measure of gDNA Integrity , as well as to standardize Integrity measurements, a software algorithm has been developed for the Genomic DNA ScreenTape assay. Based on the analysis of approximately 7,000 different gDNA samples, this algorithm provides a numerical assessment of gDNA Integrity referred to as the DNA Integrity Number (DIN). This functionality, in conjunction with the TapeStation Analysis Software (revision or higher), automatically determines and displays DIN as a measure of gDNA Integrity . Data fi les generated with a previous version of the software can be reanalyzed after a software upgrade to determine Technical Overview evaluates the robustness, in terms of reliability and reproducibility, of DIN generated with the 2200 TapeStation system and the Genomic DNA ScreenTape assay for gDNA samples, including Formalin-Fixed Paraffi n-Embedded (FFPE) below 2,000 bp.
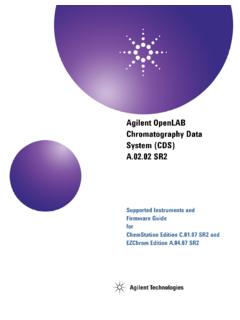
3 Both gel images and electropherogram traces allow visual determination of a gDNA sample for Integrity , however this approach is highly subjective. To provide an objective and standardized tool for reliable Integrity assessment, the DNA Integrity Number (DIN) algorithm was developed. DIN determines the fragmentation of a genomic DNA sample by assessing the distribution of signal across the size range, and applies an automatically calculated Number . DIN was generated using approximately 7,000 samples from a wide variety of genomic DNA sources comparing the signal against each and every sample. Results and DiscussionThe gel image, as well as the electropherogram overlay in Figure 1, demonstrate the shift in DNA size and distribution with increasing degradation from right to left.
4 Highly intact gDNA samples migrate as a single fragment in the gel image and a well-defi ned peak in the electropherogram above the largest ladder peak (48,500 bp). With increasing degradation, a shoulder of small gDNA fragments was formed and the main peak was shifted towards smaller sizes. Highly degraded gDNA appears as a smear in the gel image, and migrates as broad peak in the elctropherogram with ExperimentalMaterialsCommercially available intact human gDNA was purchased from Promega (Madison, WI, USA). A Digital Sonifi er was used from Branson Ultrasonics (Danbury, CT, USA). Insulin syringes Omnican 50 (30G 8 mm) were obtained from B. Braun Melsungen AG (Melsungen, Germany). The 2200 TapeStation system (p/n G2965AA) with the Agilent TapeStation Analysis Software (revision ), Genomic DNA ScreenTape consumable (p/n 5067-5365) and Genomic DNA Reagents (p/n 5067-5366) were obtained from Agilent Technologies (Waldbronn, Germany).
5 SamplesApproximately 7,000 gDNA samples of eukaryotic origin including blood, dried blood spots, saliva, invertebrate, varying human tissues, and FFPE samples were kindly provided by customers. For robustness validation, commercially available gDNA was degraded using ultrasonication (10 % amplitudes, 2 second treatment, 5 second pause, up to 120 second treatment) or shearing with a fi ne gauge needle or a combination of both to generate a set of 15 gDNA samples with a wide range of gDNA degradation (gDNA Sample 1 highest Integrity and gDNA Sample 15 highest degradation). Genomic DNA analysis with the Agilent 2200 TapeStation systemDNA analysis was performed according to the Genomic DNA ScreenTape system Quick Guide1. In brief, 1 L gDNA was mixed with 10 L Genomic DNA Sample buffer.
6 Genomic DNA ScreenTape consumable, fi ltered loading tips, and the prepared samples were placed in the 2200 TapeStation instrument. The 2200 TapeStation system loaded, electrophoresed, imaged, and presented digitally analyzed results in less than 2 minutes per sample. 05001002504006009001,2001,5002,0002,5003 ,0004,0007,00015,00048,5001,0001,500 Increasing degradationSample intensity (FU)bp48,50015,0007,0004,0003,0002,5002, 0001,5001,200900600400250100A1 (L) (bp)ABFigure 1. A degradation series of 15 gDNA samples (at 60 ng/ L) was analyzed using the Agilent 2200 TapeStation system and the Agilent Genomic DNA ScreenTape assay to determine DIN. A) The gel image with DIN displayed below each lane for gDNA sample 15 to 1 from left to right. B) The electropherogram overlay of all 15 gDNA provide a numerical assessment, the samples were assorted according to their signal distribution to a scale of DIN 1 to 10.
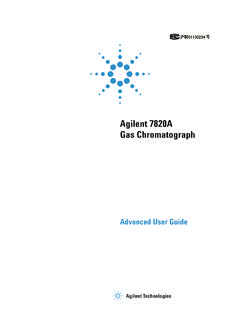
7 A high DIN indicates highly intact gDNA, and a low DIN a strongly degraded gDNA sample. Robustness and reproducibilityA set of 15 gDNA samples representative for the entire degradation range of the 7,000 samples was generated. The determined scores for the 15 gDNA samples ranged from DIN to Figure 1 provides a gel image and an overlay of the electropherogram for the 15 samples, and DIN is displayed directly under the individual lanes of the gel image. Using this standardized sample set the robustness and reproducibility of the algorithm in terms of independency of sample concentration, Genomic DNA Reagent batch, Genomic DNA ScreenTape device batch, TapeStation system type, and sample position on 96-well plates was genomic DNA samples representative for high, middle, and low Integrity samples were analyzed at six different concentrations, covering the whole DIN specifi ed functional range from 5 to 300 ng/ L, to demonstrate that DIN is independent of the sample concentration.
8 Figure 2 clearly shows that the determined DIN for all three gDNA samples does not depend on the loaded DNA concentration within the DIN functional subsequent set of experiments was performed to prove that there is no infl uence of ScreenTape device batch (n = 4) or Genomic DNA Loading Buffer batch (n = 3) on the determined DIN for all 15 gDNA different instruments are available for the 2200 TapeStation system; the standard instrument is suitable for RNA, DNA, and protein analysis. The Nucleic Acid instrument is suitable for analysis of nucleic acids only. Both instruments types were used to analyze the set of 15 gDNA samples, to demonstrate that there is no effect of the instrument type on the determined DIN (data not shown). The 2200 TapeStation system allows the analysis of samples from a 96-well plate.
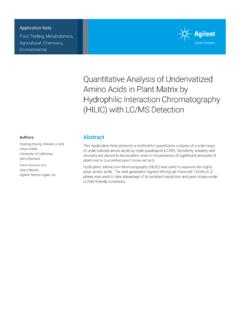
9 To test the stability and reproducibility of DIN, three gDNA samples selected across the Integrity range were analyzed with n = 32 from a 96-well plate. Figure 3 clearly illustrates that the standard deviation for the average DIN for all three tested samples is small and, more importantly, stable across a 96-well plate measurement cycle. Figure 3. Three gDNA samples (at 25 ng/ L) were analyzed from a 96-well plate using the Agilent 2200 TapeStation system and the Agilent Genomic DNA ScreenTape assay. The corresponding averaged DIN and the standard deviation are shown (n = 32).gDNA Sample 1gDNA Sample 8gDNA Sample 14 DIN DIN DIN 12345678910020406080100 DINL ocation on 96-well plate12345678910gDNA Sample 3gDNA Sample 7gDNA Sample 13 DIN5 ng/ L10 ng/ L30 ng/ L60 ng/ L100 ng/ L300 ng/ LFigure 2.
10 Three gDNA samples were diluted to six different concentrations and analyzed using the Agilent 2200 TapeStation system and the Agilent Genomic DNA ScreenTape assay. Averaged DIN and standard deviation are plotted in this graph (n = 10 to 15). Research Use Only. Not for use in diagnostic information contained within this document is subject to change without prior notice. Agilent Technologies, Inc., 2015 Published in the USA, December 1, 20155991-5258 ENReference1. Agilent Genomic DNA ScreenTape System Quick Guide, Agilent Technologies, publication Number G2964-90040 , 2014. Figure 4 summarizes the data from the above described experiments. The average DIN and the standard deviation were calculated and is highly reproducible, across different sample concentrations, instrument types, batches of ScreenTape device and Loading Buffer Reagent, and 96-well plate positions, respectively.