Transcription of EDPR Horizontal Chapters - ec.europa.eu
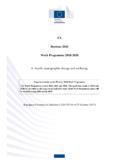
1 Connectivity Broadband market developments in the EU. Digital Economy and Society Index Report 2018. Connectivity The Digital Economy and Society Index (DESI) is a composite index that summarises relevant indicators on Europe's digital performance and tracks the progress of EU Member States in digital competitiveness. The five dimensions of the DESI. 1 Connectivity Fixed Broadband, Mobile Broadband, Fast and Ultrafast Broadband and Prices Denmark, Sweden, Finland and the Netherlands have the most 2 Human Capital Basic Skills and Internet Use, Advanced skills and advanced digital economies in the EU followed by Luxembourg, Development Ireland, the UK and Belgium.
2 3 Use of Internet Citizens' use of Content, Communication and Online Romania, Greece, Bulgaria and Italy have the lowest scores on Services Transactions the index. 4 Integration of Business Digitisation and E-commerce Digital Technology 5 Digital Public eGovernment and eHealth Services Digital Economy and Society Index (DESI) 2018. 80. 1 Connectivity 2 Human Capital 3 Uses of Internet 4 Integration of Digital Technology 5 Digital Public Services 70. 60. 50. 40. 30. 20. 10. 0. DK SE FI NL LU IE UK BE EE ES AT MT LT DE EU SI PT CZ FR LV SK CY HR HU PL IT BG EL RO.
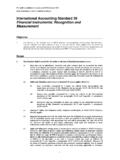
3 Source: DESI 2018, European Commission DESI Report 2018 Connectivity 2. For Connectivity, the highest score was registered by the Netherlands followed by Luxembourg, Denmark and Sweden. Greece, Croatia and Italy had the weakest performance in this dimension of the DESI. Connectivity indicators in DESI 2018 EU. The connectivity dimension looks at both the demand and the supply side of 1a1 Fixed Broadband Coverage 97%. fixed and mobile broadband. Under fixed broadband, it assesses the % households 2017.
4 Availability as well as the take-up of basic, fast (Next Generation Access 1a2 Fixed Broadband Take-up 75%. % households 2017. NGA providing at least 30 Mbps ) and ultrafast (at least 100 Mbps). 1b1 4G Coverage 91%. broadband and also considers the prices of retail offers. On mobile % households (average of operators) 2017. broadband, the availability of 4G and the take-up of mobile broadband are 1b2 Mobile Broadband Take-up 90. included. Digital Connectivity is considered as a social right in the EU*.
5 Subscriptions per 100 people 2017. 1c1 Fast Broadband (NGA) Coverage 80%. A comparative assessment of fixed broadband (basic, fast and ultrafast). % households covered by VDSL, FTTP or Docsis 2017. shows the Netherlands, Belgium, Luxembourg, Malta and Denmark, as the 1c2 Fast Broadband Take-up 33%. strongest performers. In contrast, Greece, Poland, Italy and Croatia are % homes subscribing to >= 30 Mbps 2017. shown to be among the weakest performers. 1d1 Ultrafast Broadband Coverage 58%. % households covered by FTTP or Docsis 2017.
6 As for mobile broadband, the Nordic countries (Finland, Sweden and 1d2 Ultrafast Broadband Take-up Denmark) lead Europe along with Latvia and Poland, while the lowest scores % homes subscribing to >= 100 Mbps 2017. were registered by Hungary, Greece and Romania. 1e1 Broadband Price Index 87. * Score (0 to 100) 2017. Digital Economy and Society Index (DESI) 2018, Connectivity 90. 1a Fixed Broadband 1b Mobile Broadband 1c Fast Broadband 1d Ultrafast Broadband 1e Broadband price index 80. 70. 60. 50. 40.
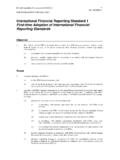
7 30. 20. 10. 0. NL LU DK SE BE MT UK PT FI LV IE LT DE ES EE CZ AT EU28 HU CY SI PL RO FR SK BG IT HR EL. Source: DESI 2018, European Commission DESI Report 2018 Connectivity 3. Total telecom services revenues have slightly declined (by %) in Europe since 2014. Mobile and fixed voice revenues have decreased by 16 % since 2014. An increase in mobile data and internet services was not enough to offset the major decline in voice services. Total Telecommunication revenues per region, billion , 2014-2018. 350.
8 Telecom operators in Europe generated less revenue than the 302 306 310. 313. US operators. Revenues went slightly down from EUR 220 300 297. billion in 2014 to EUR 213 billion in 2017 in Europe. At the 250. same time, the US revenues also slightly increased from EUR 213. 213. 297 billion to EUR 310 billion, despite its smaller population. 200 220 216 214. 184. China increased its revenues by %, from EUR 149 billion 150. 149 151. 167. 179. in 2014 to EUR 179 billion in 2017. 100. 96 95 95 95 95. 50 58 58 59.
9 Note: this analysis is based on detailed figures from 26 Member States, 57. 59. which covered about 98% of the total EU market (total telecom carrier 0. services). 2014 2015 2016 2017 Forecast 2018. EU26 JAPAN CHINA US Brazil The analysis of telecommunications revenues (carrier services) by Telecom services revenues by segment, EU 26*, % of total, 2014 - 2018. segment shows a decline in voice services (both fixed and mobile) 100%. revenues. Fixed voice service revenues have fallen by % since 2014, 90%.
10 Compared to % for mobile services over the same period (2014 80%. 49% 48% 48% 48% 48%. 2017). Together, fixed and mobile voice services represented 44 % of total 70%. telecom revenues in 2017, compared with 51 % in 2014. 60%. 50%. Mobile data services represented 27 % of total revenues in 2017, up from 40%. 24 % in 2014. The growth in mobile data services could not, however, 30% 44% 44% 45% 45% 45%. compensate for the major decline in voice services and overall revenues 20%. fall by 3 %. 10%. 0% 7% 7% 7% 8% 8%.