Transcription of Edwards FloTrac Sensor & && & Edwards Vigileo Monitor
1 1 Understanding Stroke Volume VariationUnderstanding Stroke Volume Variationand Its Clinical Applicationand Its Clinical ApplicationEdwardsEdwardsEdwardsEdwardsE dwardsEdwardsEdwardsEdwardsFloTrac FloTrac FloTrac FloTrac FloTrac FloTrac FloTrac FloTrac SensorSensorSensorSensorSensorSensorSens orSensor& & & & & & & & Edwards Vigileo Edwards Vigileo Edwards Vigileo Edwards Vigileo Edwards Vigileo Edwards Vigileo Edwards Vigileo Edwards Vigileo MonitorMonitorMonitorMonitorMonitorMonit orMonitorMonitor2 Topics System Configuration Pulsus Paradoxes Reversed Pulsus Paradoxus What is Stroke Volume Variation (SVV)?
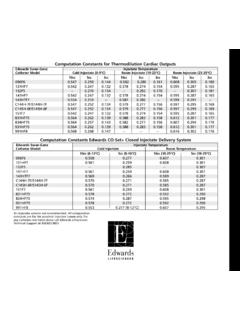
2 How is SVV Calculated? Sensitivity and Specificity Clinical Application of SVV Limitations of SVV3 System ConfigurationVigileomonitorEdwards PreSep catheter(ScvO2)Venous OximetryVenous OximetryCardiacCardiacOutputOutputFloTra csensor(arterial catheter)The Vigileo Monitor by Edwards Lifesciences supports both the FloTrac Sensor for continuous cardiac output and the Edwards PreSep central venous catheter for continuous central venous oximetry (ScvO2)4 Vigileo Monitor Continuously computes stroke volume from the patient s arterial pressure signal Displays key hemodynamic parameters on a continuous basis (every 20 sec) Requires NO manual calibration The user simply enters patient age, gender, height and weight to initiate monitoring Advanced waveform analysis compensates for.
3 Patient-to-patient differences in vasculature Real time changes in vascular tone Differing arterial sites Venous oximetry available when used with appropriate Edwards oximetry cathetersThe Vigileo Monitor continuously displays and updates Continuous Cardiac Output, Cardiac Index, Stroke Volume, Stroke Volume Index, Systemic Vascular Resistance*, Systemic Vascular Resistance Index*, and Stroke Volume Variation every 20 seconds when used with the FloTrac Sensor . DO2 and DO2I are also available for manual calculation.** These parameters help guide the clinician in optimizing stroke volume through precision guided management of preload, afterload, and tone = vessel compliance and resistanceThe Vigileo Monitor then helps identify the adequacy of cardiac output by monitoring central venous (ScvO2) or mixed venous (SvO2) oxygen saturation when used with Edwards venous oximetry technologies.
4 * These parameters require the CVP value to be slaved from bedside Monitor for continuous monitoring. SVR/SVRI can also be assessed on the Derived Value Calculator for intermittent calculations using either slaved or manually entered MAP, CVP, and CO values.**These parameters require the SpO2 and PaO2 values to be manually entered. If CO is being continuously monitored, the calculator will default to the existing CO value. Otherwise, the user may override the continuous value to manually enter specially designed FloTrac Sensor provides the high fidelity arterial pressure signal required by the Vigileomonitor to calculate the stroke volumeThe Vigileo Monitor uses the patient s arterial pressure waveform to continuously measure cardiac output.
5 With inputs of height, weight, age and gender, patient-specific vascular compliance is determined. The FloTrac Sensor measures the variations of the arterial pressure which is proportional to stroke volume. Vascular compliance and changes in vascular resistance are internally compensated for. Cardiac output is displayed on a continuous basis by multiplying the pulse rate and calculated stroke volume as determined from the pressure waveform. The FloTrac Sensor is easily setup and calibrated at the bedside using the familiar skills used in pressure Volume Variation7 Normal Variation & Pulsus ParadoxusArterial PressureTimeIn a normal individual who is breathing spontaneously, blood pressure decreases on inspirationThe exaggeration of this phenomenon is called pulsus ParadoxusExpirationInspirationIn a normal individual who is breathing spontaneously, blood pressure decreases on inspiration.
6 The range of normal peak decreases in systolic pressure have been reported between 5 10 exaggeration of this phenomenon, called pulsus paradoxus, was initially reported by AdolfKussmal in constrictive pericarditis and was described as a pulse disappearing during inspiration and returning during expiration despite the continued presence of the cardiac activity during both respiratory phases. Michard F. Changes in Arterial Pressure During Mechanical Ventilation. Anesthesiology 2005; 103 A. Pulsus Paradoxus in Cardiac Tamponade: A Pathophysiologic Continuum, Clinical Cardiology 2003; 26, 215-2178 Reversed Pulsus ParadoxusArterial PressureTimeA phenomenon that is the reverse of the conventional pulsus paradoxus has been reported during positive pressure breathingF.
7 MichardA phenomenon that is the reverse of the conventional pulsus paradoxus has been reported during positive pressure breathing. The inspiratory increase in arterial blood pressure followed by a decrease on expiration has been called at different times: Reversed pulsus paradoxus Paradoxical pulsus paradoxus Respirator paradox Systolic pressure variation (SPV) Pulse pressure variationAt least 12 peer-reviewed English-language studies have demonstrated the usefulness of the respiratory variation in arterial pressure (or its surrogates) in answering a crucial clinical question; Can we improve cardiac output and hence hemodynamics by giving fluid?
8 Michard F. Changes in Arterial Pressure During Mechanical Ventilation. Anesthesiology 2005; 103 and Mechanical VentilationArterial PressureTimeInspirationControlled VentilationExpiration Controlled VentilationAirway PressureMechanical ventilation induces cyclic changes in vena cava blood flow, pulmonary artery blood flow, and aortic blood flow. At the bedside, respiratory changes in aortic blood flow are reflected by swings in blood pressure whose magnitude is highly dependent on volume status. (Michard)The left ventricular stroke volume increases during inspiration because left ventricular preload increases while left ventricular afterload decreases.
9 In contrast, the right ventricular stroke volume decreases during inspiration because right ventricular preload decreases while right ventricular afterload increases. Because of the long (approximately 2 sec) pulmonary transit time of blood, the inspiratory decrease in right ventricular filling and output only a few heartbeats later, , usually during the expiratory period. (Michard)In healthy patients undergoing neurosurgery, a SVV value of was found to predict a positive (=5%) increase in stroke volume in response to only 100ml of plasma expander with a 79% sensitivity and 93% specificity.
10 (Berkenstadt)Currently, the majority of clinical literature supports the use of SVV in patients who are only mechanically ventilated. 10 SVV as it is Traditionally CalculatedSVmax- SVminSVV=SVmeanThe above equation is the conventional method by which SVV is calculated. The difference between the maximum and minimum stroke volumes within a given time are divided by the mean of the maximum and minimum SVs. The SVV is displayed as a percent & Specificity of SVV9379 SV >5% SVV 10 NeurosurgeryBerkenstadt et CO >15% PP (R or F)8 to 12 SepsisMichardSpecificitySensitivityDef.