Transcription of Electric Vehicle Charging Implications for Utility ...
1 Electric Vehicle Charging Implications for Utility Ratemaking in ColoradoDavid Hurlbut, Joyce McLaren, Sam Koebrich, Juliana Williams, and Emily ChenBackground Research for Colorado Public Utilities Commission nrel | 2 Questions and InsightsState of EV ResearchColorado EV Load ModelUtility EV Pilots and RatesEV Charger TechnologyFleet ChargingInsights (Recap)1234578 ContentsPublic Direct-Current Fast Charging (DCFC)61. Questions and InsightsQuick SummaryNREL | 4 System impacts of Charging behaviors What EV Charging behaviors might systematically increase or decrease the Utility s cost of service in Colorado? Charging during periods with low system cost The ability to vary Charging load up or down in the evening to balance load and maintain system stability What is the difference between natural (unincentivized) EV Charging patterns and Charging patterns that minimize the cost of electricity service?
2 Time-of-use (TOU) rates would likely mitigate peak load growth by shifting Charging load to low-cost hours However, the 9 TOU transition period could result in a new evening peak as well as a brief but steep demand ramp, if EV adoption is high and Charging is not spread outNREL | 5 System impacts of Charging behaviors How would load profiles change if they reflected reasonably achievable behaviors that reduced the cost of service? Controlled Charging , if used extensively and if EV adoption were high, might mitigate the tendency for a new peak to form under existing TOU ratesNREL | 6 Getting ready Are there make-ready investments by the Utility that might encourage desirable load growth for EV Charging ?
3 High-density residential buildings (condos and apartments) are a potential focus area where EV demand might currently be suppressed due to the lack of L2 (240v) Charging capability A review of PUC rules that govern master metering could identify possible amendments specific to EV Charging in multifamily residences, and inform the design of Utility programs to target make-ready investments in multifamily developments where the chances of both EV use and cost recovery are highNREL | 7At-work Charging What effect could electricity rates have on at-work Charging ? At-work Charging makes up a small portion of total EV Charging , so the system benefits are likely to be small Company policies affecting at-work EV Charging (free vs fee, open vs assigned spaces) are outside the sphere of electricity rate making2.
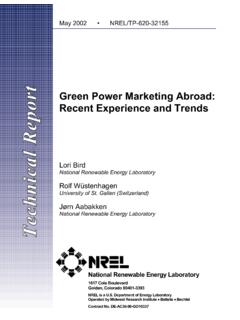
4 State of EV ResearchNREL | 9 Main areas of EV research and analysisSources of new value that can, if tapped, reduce the chance of cross-subsidizationPrice signals for accessing new value; avenue for justly and reasonably allocating costs and rewardsDetermines affected customer classesNREL | 10 Most EV Charging happens at homeAt present, the tendency is for more than 80% of EV Charging load (and as much as 93% under some scenarios) to happen at home, mostly in the evening. The rest is divided between public Charging and workplace simulation for Colorado using EVI-Pro, with electricity costs from Colorado Utility rate booksHours when system cost is above the daily meanNREL | 11 Unknown: EVs and multifamily residential customers Known: The income bracket known to purchase the most EVs includes many who live in multifamily housing.
5 Regulatory question: Do submetering rules affect infrastructure for EV Charging in multifamily housing, and could this affect EV demand?(Muehleggerand Rapson; Census Bureau, american Housing Survey. Photo by Dennis Schroeder, nrel 27455)0%10%20%30%40%50%60%TotalLess than$10,000$10,000 to$19,999$20,000 to$29,999$30,000 to$39,999$40,000 to$49,999$50,000 to$59,999$60,000 to$79,999$80,000 to$99,999$100,000 to$119,999$120,000 ormoreHousehold IncomeColoradoMetro DenverIncomebracket for 86% of BEV,PHEV salesIncome bracket for 30% of BEV,PHEV salesMultifamily housing by income (% of all housing) nrel | 12 Other current gaps in EV research Alternative business models for Charging stations Financing models for Charging stations Impact of range anxiety on economics of public Charging stations (and, ultimately, on EV purchase decisions)
6 Number, type, and distribution of chargers needed to support rollout of EVs nrel s EVI-Pro model was developed to help answer these questionsNREL | 13 Major existential gap The behaviors we observe in today s nascent EV market might change as the market matures Example: No way to know empirically today whether home Charging will continue to dominate 10 years from now Example: Cost of L2 smart chargers in the event of increased demand for control functions The value of looking at today s phenomena is to form questions, recognizing that the answers might change as EVs become mainstream3. Colorado EV Load ModelNREL | 15 Key Insights: EV adoption scenario analysis Absent systemic changes in customer behavior, the vast majority of EV Charging will occur at home.
7 Without an incentive or disincentive in place, this Charging may significantly contribute to system peak demand. While existing TOU rates could incentivize EV owners to delay their Charging , without staggering this Charging , new daily peaks can emerge under the Colorado Energy Office s (CEO) medium and high adoption scenarios. Demand response (DR) can be used to distribute the overnight Charging of EVs during times when the cost of energy is less expensive to flatten the daily load profile. An advanced deployment of demand response could use a network of EV home chargers to respond to wind interactive version of the model developed for this study is available online at nrel | 16EV adoption scenario analysis Based on the issues identified by our literature review and qualitative research, we sought to create a bottom-up simulation to assess how the scale of EV adoption and various Charging behaviors can change load patterns in the Public Service Company of Colorado (PSCo) balancing authority area.
8 * Questions: In a business as usual (BAU) scenario, does Charging align with the existing evening peak demand? How does Charging differ by location and Charging type (home, workplace, DCFC)? Would a TOU rate reduce the evening peak? Can Charging be coordinated to better align with times with a low marginal cost of energy (system lambda value)?* In this study, PSCo refers to the balancing authority and Xcel refers to the | 17 Eight modeled scenariosNumber of EVSC harging BehaviorDescriptionCEO Medium 2030 Adoption (302,429 EVs)100% No Delay (all immediate on-demand Charging )Business as usual50% No Delay / 50% TOUM oderate utilization of existing TOU rates50% No Delay / 50% Demand ResponseModerate utilization of controllable charging34% No Delay / 33% TOU / 33% Demand ResponseSplit between various programsCEO High 2030 Adoption (940,000 EVs)
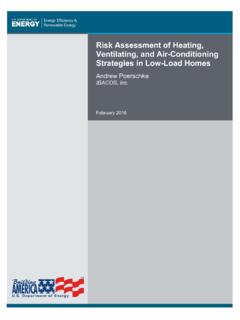
9 100% No DelayBAU with high EV adoption50% No Delay / 50% TOUHigh utilization of existing TOU rates50% No Delay / 50% Demand ResponseHigh utilization of controllable charging34% No Delay / 33% TOU / 33% Demand ResponseSplit between various programs Scale of EV adoption is based on scenarios outlined by the Colorado Energy Office (CEO 2015) nrel | 18No delay / TOU scenarios: average loadHours when PSCosystem marginal cost is above meanNew peakNew secondary peakLowEV adoption, 50% utilization of existing TOU plan (average load by hour) (BCS Incorporated 2015)MediumEV adoption, 50% utilization of existing TOU plan (average load by hour) HighEV adoption, 50% utilization of existing TOU plan (average load by hour) nrel | 19No delay / DR scenarios.
10 Average loadHours when PSCosystem marginal cost is above meanLowEV adoption, 50% utilization of residential DR Charging (average load by hour) (BCS Incorporated 2015)MediumEV adoption, 50% utilization of residential DR Charging (average load by hour) HighEV adoption, 50% utilization of residential DR Charging (average load by hour) DR fills in valley overnightNREL | 20 Insights What EV Charging behaviors might systematically increase or decrease the Utility s cost of service in Colorado? Charging during periods with low system cost How would load profiles change if they reflected reasonably achievable behaviors that reduced the cost of service? TOU rates would likely mitigate peak load growth by shifting Charging load to low-cost hours However, the 9 TOU transition period could result in a new evening peak as well as a brief but steep demand ramp, if EV Charging is not spread out using DRNREL | 21EV Charging and integrating renewables Many EV-DR studies to date have focused on California, where the system is solar-heavy.