Transcription of EnginEEring by thE numbErs
1 EnginEEring by the numbErs By Brian L. Yoder, A Note on Data in the 2016 Profiles: over the previous year, with both showing an 11 percent In a change from previous issues of Profiles, ASEE has decided gain. Petroleum EnginEEring and Mining EnginEEring had the to omit data from schools that have not participated in our largest percentage drop in enrollment, showing a decrease survey for more than two years. In the past, we carried for- of 22 percent and 23 percent, respectively. ward data from prior years for non-participating schools so as to maintain a consistent benchmark. As a result of our tightened inclusion requirements, tabulations in this issue Master's Degrees and Enrollment of Profiles exclude data from 50 colleges. This difference Master's degrees awarded in 2016 increased by 9 percent accounts for totals that are noticeably lower than in the 2015 over 2015, reflecting a higher growth rate than the per- Profiles: 13,000 fewer undergraduate EnginEEring students, cent average annual increase in degrees awarded since 2007.
2 Awards of 2,000 fewer bachelor's degrees, and a decrease in EnginEEring disciplines with the largest percentage increase in master's-level enrollment. Schools excluded from tabulations degrees awarded included Civil/Environmental EnginEEring , were mostly smaller institutions, many with undergraduate which granted 24 percent more degrees in 2016 than in 2015, EnginEEring programs only. and Computer Science (inside EnginEEring ) which granted 20 percent more degrees in 2016 over the previous year. Despite the lower totals, which reflect current data from participating schools, ASEE's survey results show substantial As with bachelor's degrees, the trend of strong growth in mas- growth in EnginEEring schools over the past 10 years. Recent ter's degrees is unlikely to continue in coming years. Enrollment enrollment numbErs , however, suggest that EnginEEring may in EnginEEring master's degree programs decreased by 3.
3 Be now entering a period of slower growth. percent from 2015 to 2016 to 127,159. Enrollment in master's degree programs has increased by 42 percent since 2007, or percent per year, on average. Bachelor's Degrees and Enrollment The number of students awarded bachelor's degrees in engi- neering rose by 6 percent from 2015 to 2016, slightly above the Doctoral Degrees and Enrollment average percent annual increase in bachelor's degrees in EnginEEring doctoral degrees decreased slightly from 2015. EnginEEring since 2007. EnginEEring Science and EnginEEring to 2016 less than 1 percent breaking a trend that saw the Physics, and Computer Science (inside EnginEEring ) had the award of doctorates increase by an average of percent a largest percentage increases in 2016 over the previous year: year over the previous decade. The EnginEEring disciplines 24 percent and 23 percent, respectively.
4 Electrical/Computer with the largest percentage drop in doctoral degrees included EnginEEring and Mining EnginEEring had the largest percent- Petroleum EnginEEring , which fell 18 percent, and Electrical/. age decline from 2015 to 2016, a decrease of 17 percent and Computer EnginEEring , which declined by 10 percent. a decrease of 8 percent, respectively. Enrollment in doctoral programs flattened, increasing by 1. Enrollment trends indicate that the number of bachelor's percent from 2015 to 2016, following a 31 percent growth degrees may not continue to grow at its recent pace. Growth in 2007, or an average percent per year. Civil/Environmental undergraduate EnginEEring enrollment is slowing after more EnginEEring and EnginEEring (General) showed the largest than a decade of strong annual increases. Our benchmark percentage increases in doctoral enrollment of 30 percent in 2016 shows a decrease from 2015 of 10,026 full-time and and 19 percent, respectively, from 2015 to 2016.
5 Part-time students enrolled in an undergraduate engineer- ing program. That number takes into account the exclusion of non-participating schools, which resulted in 13,000 fewer EnginEEring Students from Other Countries enrolled EnginEEring students. If the excluded schools' data EnginEEring degrees earned by students from outside the from previous years had been included in the latest totals, our United States increased from 2015 to 2016. The proportion of benchmark would show a slight increase in 2016 over 2015, bachelor's degrees earned by non-resident aliens increased but a lower rate of growth than the annual average for the from percent to percent, reaching a new high mark past 10 years. Based on this year's benchmark, undergraduate for this cohort. After dropping in 2008 and 2009 to a low of EnginEEring enrollment has grown by 57 percent since 2007, percent, the proportion of bachelor's degrees awarded an average increase of percent per year.
6 Civil EnginEEring / to non-resident aliens has increased every year since. The Environmental EnginEEring and Computer Science (inside proportion of master's degrees awarded to non-resident aliens EnginEEring ) had the largest percentage increase in 2016 increased by more than 11 percent, from percent in 2015. By the numbErs to percent in 2016. Since 2007, when non-resident aliens accounted for of master's degrees, their representation has increased nearly 20 percent. Students from outside the United States accounted for percent of doctoral degrees awarded in 2016, maintaining a rate that has been consistent since 2008. Female EnginEEring Students Female EnginEEring students continued their slow increase as a percentage of EnginEEring degrees awarded at all degree levels: bachelor's, master's, and doctoral. The proportion of women among students receiving a bachelor's degree increased by one percent in 2016 over the previous year, to percent.
7 The representation of women among bach- elor's degree recipients has risen from percent in 2007. to percent in 2016. The highest proportion of degrees awarded to women in 2016 was at the master's level percent. This represented a slight percent increase over 2015. and a three percent increase since 2007. The representation of females among doctoral degree recipients also increased slightly from percent in 2015 to percent in 2016. The proportion of women among doctoral degree recipients has increased percent from since 2007, when they made up percent of that cohort. Faculty The number of tenured and tenure-track faculty increased to 27,907 in 2016. The number of full professors and assistant professors increased by 538 and 710, respectively, while the number of associate professors decreased by 180 from the fall of 2015 to the fall of 2016.
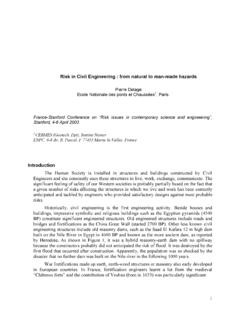
8 The percentage of faculty members who are women increased by half a percent from 2015 to percent in 2016. The representation of African Americans decreased slightly to percent in 2016, while that of Asian faculty increased to percent and that of Latinos rose to percent. More detailed data for 351 and 9 Canadian EnginEEring colleges can be found in the following pages of the 2016. Profiles of EnginEEring and EnginEEring Technology Colleges or online at Brian Yoder is director of assessment, evaluation and institutional research at the American Society for EnginEEring Education. He can be contacted at 12 For more information, visit the ASEE Web site at (AD SPACE). Bachelor's Degrees, 2015 2016 By the numbErs Bachelor's Degrees Awarded by EnginEEring Discipline: 112,721*. 26,816. 25,000. 20,000. 15,000 13,483. 11,892. 11,464. 9,864.
9 10,000. 6,177. 5,649 5,531 5,407. 5,000 4,386. 3,781. 2,860. 1,858 1,659. 1,338 1,236 1,160. 940 674 618. 521 506 308. 0 l ms er ). l .) l il l er e er ls m al) al al al s al ar nt g g. ica ng ica Civ mica dica ste put th pac put eria leu ner ent ltur ent ysic ctur cle me inin En h an e E ectr e e S y m O s m t a et (G r o e m u m h e u e M e ec id El Ch Biom ing/ Co ro o n ric n .P it N ag sid M (Ins Ae al/C l & M P ing nviro Ag nviro ng Arch an ut i . t ur i c c a e r E l & E E M . ( O. c c tr rgi l / & g i rS uf a ec ine ica Civi nce rin Sc u te an El tallu E ng o log i e i n ee t er M e i c u mp al/ M B. g. S En g mp Co tri d us En Co In *Total does not include computer science (outside EnginEEring ). Percentage of Bachelor's Degrees Awarded to Women by Discipline: of Total 50%. 40%. 30% 20% 10%. 0 al l l l l s l) l s r t il s r.
10 R g e l l r .). e nt dica ltura mica tura tem era enta rial the men Civ ysic clea Eng leum pute inin pac nica trica pute Eng c s n e O a nm me icu he ite Sy e nm at ge Ph Nu ide etr om o M ros ch ec m El Co tsid e v iro Bio Agr C rch ng/ g (G viro & M a na n g. I n s P l/C A e M. e u En & i A ur rin En al M E ( a al ct nee ivil/ rgic ci. ric (O. i c f a i u r ing c e &. r S l e ct ci. o g n u g C l l e e n e E S. ol a En et a in cie ut er Bi l/M M E ng .S mp p ut i a g o m tr En C. d us Co I n 14 For more information, visit the ASEE Web site at By the numbErs EnginEEring Bachelor's Degrees, 2007 2016. EnginEEring Bachelor's Degrees Awarded by School 1. Georgia Institute of Technology 2,140 Bachelor's Degrees by Gender, 2016. 2. Univ. of Illinois, Urbana-Champaign 2,111. 3. Pennsylvania State University 1,797. 4. Virginia Tech 1,635.))