Transcription of nginEEring by thE numbErs - asee.org
1 engineering by thE numbErsBy Brian L. Yoder, bachElor s EnrollmEnt and dEgrEEsEnrollment in undergraduate engineering programs reached its highest point in 10 years with 619,095 full-time engineering students in 2017, a 3 percent increase over the prior year and a 54 percent increase over undergraduate enrollment in 2008. Degrees awarded reached 124,477, also the highest level in 10 years; a 10 percent increase over 2016 and a 68 percent gain since disciplines that awarded the most degrees in 2017 were mechanical engineering , with 30,030 degrees; computer science (inside engineering ), with 15,305 degrees; and electrical engineering , with 12,893 degrees. Forty-seven percent of all undergraduate engineering degrees awarded in 2017 were in these three disciplines mastEr s EnrollmEnt and dEgrEEsEnrollment in master s degree engineering programs in 2017 stood at 86,872 students, just 100 more than in 2016.
2 The number of master s degrees awarded increased slightly from the prior year. In 2017, 64,602 master s degrees were awarded, up from 62,596 in 2016. The most master s degrees awarded were in computer science (inside engineering ) with 10,602 degrees; mechanical engineering , with 8,262 degrees; and electrical engineering , with 7,832 degrees. These three disciplines accounted for 41 percent of all master s degrees awarded in 2017. doctoral EnrollmEnt and dEgrEEsEnrollment in engineering doctoral programs grew slightly, with 70,026 full-time students in 2017, an increase of less than 2,000 full-time students from graduating with a doctoral degree decreased slightly from the prior year. engineering programs awarded 11,589 doctoral degrees in 2017, down from 11,654 degrees awarded in 2016. The most doctorates awarded were in mechanical engineering , electrical/computer engineering , and electrical engineering .
3 These three disciplines accounted for 34 percent of all doctoral degrees awarded in engineering graduatEsThe proportion of engineering degrees awarded to women reached a 10-year high in 2017. Women received percent of all engineering bachelor s degrees, percent of all engineering master s degrees, and percent of all engineering doctoral degrees, representing a 2 percent to 3 percent increase over the proportion of engineering degrees awarded to females in 2008. Disciplines varied widely in the percentage of degrees awarded to women. Environmental engineering conferred the highest percentage of degrees to females at all levels: 50 percent of bachelor s degrees, percent of Master s degrees, and percent of doctoral degrees. In engineering disciplines with the most graduates mechanical engineering , computer science (inside engineering ), and electrical engineering women accounted for a smaller proportion of degrees awarded.
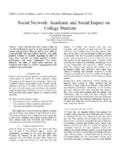
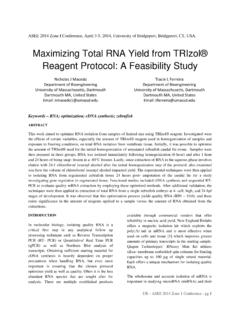
4 In 2017, female students earned percent of doctorates in mechanical engineering ; percent master s degrees in computer science (inside engineering ); and percent of bachelor s degrees in electrical engineering . 14 For more information, visit the ASEE Web site at the NumbersBachelor s Degrees awarDeD By engineering Discipline: 124,477* percentage of Bachelor s Degrees awarDeD to women By Discipline: of totalBachelor s Degrees, 2016 2017*Total does not include computer science (outside engineering ).ArchitecturalEng. Science & Eng. PhysicsMechanicalElectricalComputer Sci. (Outside Eng.)CivilBiomedicalElectrical/ComputerC hemicalIndustrial/Manufacturing/SystemsO therAerospaceComputerEngineering (General)Metallurgical & MaterialsBiological & AgriculturalEnvironmentalEngineering ManagementCivil/EnvironmentalPetroleumNu clearMining30,03015,30512,89311,92010,97 36,4416,7257,1574,6886,4394,0503,2692,03 31,7511,3011,0061,3491,58561469056655429 5 Computer Sci.
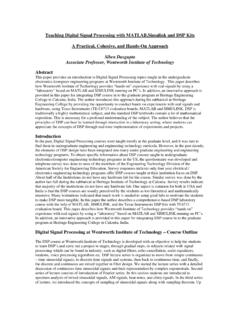
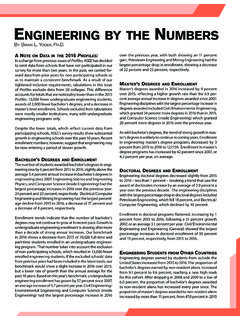
5 (Inside Eng.)05,00010,00015,00020,00025,000 MechanicalComputerElectrical/ComputerPet roleumAerospaceComputer Sci. (Inside Eng.)Eng. Science & Eng. PhysicsEngineering ManagementMetallurgical & MaterialsCivil/EnvironmentalEngineering (General)Industrial/Manufacturing/System sBiological & AgriculturalBiomedicalEnvironmentalElect ricalChemicalComputer Sci. (Outside Eng.) For more information, visit the ASEE Web site at the NumbersBachelor s Degrees By ethnicity, 2017*Bachelor s Degrees By resiDency, 2017 Bachelor s Degrees By genDer, 2017engineering Bachelor s Degrees, 2008 2017*Data on ethnicity does not include foreign nationals. American Indians ( ), Hawaiian/Pacific Islanders ( ), and Two or More ( ) are combined under Other. 2008 2009 2010 2011 2012 2013 2014 2015 2016 Black or Afr. American American Unknown 2008 2009 2010 2011 2012 2013 2014 2015 2016 Foreign Asian-American or 2008 2009 2010 2011 2012 2013 2014 2015 2016 Female Bachelor s Degrees awarDeD By school1.
6 Georgia Institute of Technology 3,0602. Univ. of Illinois, Urbana-Champaign 2,1453. University of California, San Diego 1,9214. The Pennsylvania State University 1,8255. Virginia Tech 1,7846. Texas A&M University 1,7737. Arizona State University 1,7418. The Ohio State University 1,6899. Purdue University 1,68410. University of Michigan 1,58611. North Carolina State University 1,48412. University of California, Berkeley 1,42013. Iowa State University 1,40414. University of Central Florida 1,35715. Oregon State University 1,33616. California Poly. State U., SLO 1,28617. University of Florida 1,23918. The University of Texas at Austin 1,17019. University of Minnesota -Twin Cities 1,09120. University of Washington 1,07021. Missouri Univ. of Science and Tech. 1,04722. Colorado School of Mines 1,03423. University of Maryland, College Park 1,02124. Stony Brook University 1,01225. University of Wisconsin-Madison 99026.
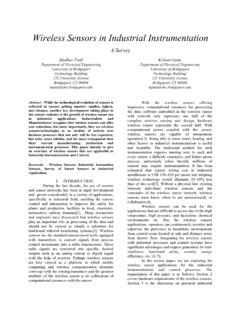
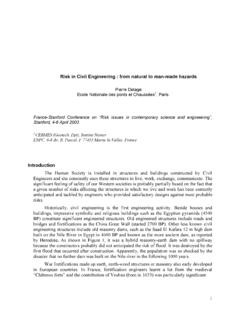
7 Clemson University 98427. Michigan State University 97428. Louisiana State University 96129. University at Buffalo, SUNY 92930. Drexel University 91431. Rutgers University 89932. California State University, Long Beach 89332. University of Colorado Boulder 89334. Florida International University 88235. Rensselaer Polytechnic Institute 86336. Cornell University 86037. California State Poly. U., Pomona 85338. Massachusetts Institute of Technology 82539. University of California, Irvine 80740. University of California, Davis 80241. University of California, Los Angeles 78542. Washington State University 77643. The University of Alabama 76844. Texas Tech University 76345. Auburn University 75046. West Virginia University 74847. George Mason University 74348. University of South Florida 73649. University of Connecticut 73550. Worcester Polytechnic Institute 700305 schools For more information, visit the ASEE Web site at the NumbersBachelor s Degrees awarDeD By ethnicity anD genDer: 124,477* *Includes 482 male and 146 female graduates from schools in Puerto Bachelor s enrollment anD DegreesUnDergraDUate enrollment By ethnicity anD genDer: 619,095*ForeignHispanicHawaiian/Pac.
8 IslanderFemaleMaleUnknownAmerican IndianAsian AmericanBlack or Afr. AmericanWhiteTwo or MoreTotal9,8092,7803,5781,0099,6012,7652 387012,0504,3073,4421,1021394555,83713,8 932,83497897,52826,94902,0004,0006,0008, 00010,000 ForeignHispanicHawaiian/Pac. IslanderFemaleMaleUnknownAmerican IndianAsian AmericanWhiteTwo or MoreTotal49,816 13,008 15,704 4,836 58,066 17,931 1,421 463 56,961 21,928 20,289 7,640 745226258,586 69,681 16,047 5,747 477,635 141,460 Black or Afr. American05,00010,00015,00020,00025,000*I ncludes 3,748 male and 1,395 female enrolled students from schools in Puerto Rico. Enrollment is for full-time students. 17 For more information, visit the ASEE Web site at the Numbersengineering Bachelor s Degrees, 2016 2017 Bachelor s Degrees awarDeD to women By school1. Georgia Institute of Technology 9122. University of California, San Diego 4403. University of Michigan 4304. Univ. of Illinois, Urbana-Champaign 3955.
9 Purdue University 3926. Texas A&M University 3907. Massachusetts Institute of Technology 3878. Virginia Tech 3749. The Ohio State University 35410. University of California, Berkeley 34611. The Pennsylvania State University 34112. The University of Texas at Austin 33613. Cornell University 33014. University of Florida 29915. North Carolina State University 28916. Clemson University 28617. University of Washington 28518. Arizona State University 28219. Colorado School of Mines 27720. California Poly. State U., SLO 26821. Oregon State University 25922. Michigan State University 25323. Rensselaer Polytechnic Institute 24924. Worcester Polytechnic Institute 24325. University of Maryland, College Park 23926. Iowa State University 23326. Stanford University 23328. University of California, Davis 23028. University of Minnesota -Twin Cities 23030. Stony Brook University 22931. University of Central Florida 22832.
10 University of Colorado Boulder 22233. University of Virginia 22134. University of Southern California 21134. University of Wisconsin-Madison 21136. Rutgers University 20637. Louisiana State University 20438. University of Pittsburgh 20039. Drexel University 19640. Missouri Univ. of Science and Tech. 19441. Case Western Reserve University 17941. University of California, Los Angeles 17943. University of California, Irvine 17644. The University of Alabama 16944. Lehigh University 16946. Columbia University 16647. University of Connecticut 16548. Auburn University 15949. University of Houston 15750. Michigan Technological University 155percentage of Bachelor s Degrees awarDeD to womenBy school* 1. Olin College of engineering Massachusetts Institute of Technology Harvey Mudd College Tulane University Brown University Dartmouth College Southern Methodist University Cornell University Princeton University University of Miami Columbia University Howard University William Marsh Rice University Coast Guard Academy The George Washington University Carnegie Mellon University Worcester Polytechnic Institute The Johns Hopkins University Stanford University Lafayette College University of Notre Dame University of San Diego Tuskegee University University of Rochester s Degrees awarDeD to asian-americans By school1.