Transcription of Environmental Effects of Increased Atmospheric Carbon …
1 Environmental Effects of Increased Atmospheric Carbon Dioxide Arthur B. Robinson, Noah E. Robinson, Willie Soon, ABSTRACT A review of the research literature concerning the Environmental consequences of Increased levels of Atmospheric Carbon dioxide leads to the conclusion that increases during the 20th and early 21st centuries have produced no deleterious Effects upon Earth's weather and climate. Increased Carbon dioxide has, however, markedly Increased plant growth. Predictions of harmful climatic Effects due to future increases in hydrocarbon use and minor greenhouse gases like CO2 do not conform to current experimental knowledge.
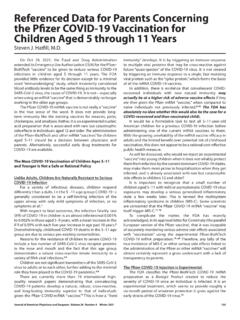
2 The Environmental Effects of rapid expansion of the nuclear and hydrocarbon energy industries are discussed. Summary Figure 2. Average length of 169 glaciers from 1700 to The principal Political leaders gathered in Kyoto, Japan, in December 1997 to source of melt energy is solar radiation. Variations in glacier mass and consider a world treaty restricting human production of length are primarily due to temperature and ,6 This melting greenhouse gases, chiefly Carbon dioxide (CO2). They feared that trend lags the temperature increase by about 20 years, so it predates the 6- fold increase in hydrocarbon use7 even more than shown in the figure.
3 CO2 would result in human-caused global warming Hydrocarbon use could not have caused this shortening trend. hypothetical severe increases in Earth's temperatures, with disastrous Environmental consequences. During the past 10 years, The most recent part of this warming period is reflected by many political efforts have been made to force worldwide shortening of world glaciers, as shown in Figure 2. Glaciers agreement to the Kyoto treaty. regularly lengthen and shorten in delayed correlation with cooling When we reviewed this subject in 1998,1,2 existing satellite and warming trends. Shortening lags temperature by about 20.
4 Records were short and were centered on a period of changing years, so the current warming trend began in about 1800. intermediate temperature trends. Additional experimental data have Atmospheric temperature is regulated by the sun, which now been obtained, so better answers to the questions raised by the fluctuates in activity as shown in Figure 3; by the greenhouse effect , hypothesis of human-caused global warming are now available. which is largely caused by Atmospheric water vapor (H2O); and by The average temperature of the Earth has varied within a range other phenomena that are more poorly understood. While major of about 3 C during the past 3,000 years.
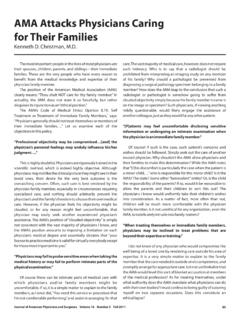
5 It is currently increasing greenhouse gas H2O substantially warms the Earth, minor as the Earth recovers from a period that is known as the Little Ice greenhouse gases such as CO2 have little effect , as is illustrated in Age, as shown in Figure 1. George Washington and his army were Figures 2 and 3. The 6-fold increase in hydrocarbon use and CO2. at Valley Forge during the coldest era in 1,500 years, but even then the temperature was only about 1 Centigrade below the 3,000- production since 1940 has had no noticeable effect on Atmospheric year average. temperature or on the trend in glacier length. Figure 1. Surface temperatures in the Sargasso Sea, a 2 million square mile region of the Atlantic Ocean, with time resolution of 50 to 100 years and ending in 1975, as determined by isotope ratios of marine organism remains 3.
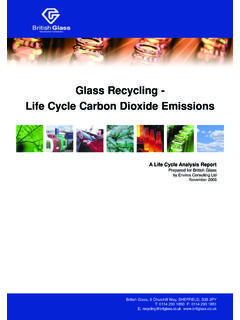
6 In sediment at the bottom of the sea. The horizontal line is the average temperature for this 3,000-year period. The Little Ice Age and Medieval Figure 3. Arctic surface air temperature compared with total solar irradiance Climate Optimum were naturally occurring, extended intervals of climate as measured by sunspot cycle amplitude, sunspot cycle length, solar departures from the mean. A value of C, which is the change in equatorial rotation rate, fraction of penumbral spots, and decay rate of the 8,9. Sargasso Sea temperature between 1975 and 2006, has been added to the 11-year sunspot cycle. Solar irradiance correlates well with Arctic 7.
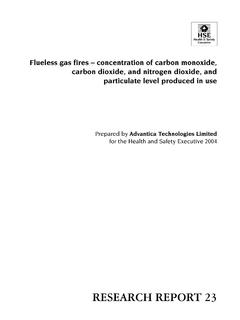
7 1975 data in order to provide a 2006 temperature value. temperature, while hydrocarbon use does not correlate. Journal of American Physicians and Surgeons Volume 12 Number 3 Fall 2007 79. Figure 4. Annual mean surface temperatures in the contiguous United Figure 6. Comparison between the current temperature change per 10. States between 1880 and 2006. The slope of the least-squares trend line century, the 3,000-year temperature range in Figure 1, seasonal and diurnal for this 127-year record is C per century. range in Oregon, and seasonal and diurnal range throughout the Earth. While Figure 1 is illustrative of most geographical locations, Figures 7 to 10.
8 Sea level has trended upward for the past 150 years at there is great variability of temperature records with location and a rate of 7 inches per century, with 3 intermediate uptrends and 2. regional climate. Comprehensive surveys of published temperature periods of no increase as shown in Figure 11. These features are records confirm the principal features of Figure 1, including the fact confirmed by the glacier record as shown in Figure 12. If this trend that the current Earth temperature is approximately 1 C lower than continues as did that prior to the Medieval Climate Optimum, sea 11,12. that during the Medieval Climate Optimum 1,000 years ago.
9 Level would be expected to rise about 1 foot during the next 200 years. Surface temperatures in the United States during the past century As shown in Figures 2, 11, and 12, the trends in glacier reflect this natural warming trend and its correlation with solar shortening and sea level rise began a century before the 60-year 6- activity, as shown in Figures 4 and 5. Compiled surface fold increase in hydrocarbon use, and have not changed during that temperatures have Increased about C per century, which is increase. Hydrocarbon use could not have caused these trends. consistent with other historical values of to C per century During the past 50 years, Atmospheric CO2 has Increased by 13-17.
10 During the recovery from the Little Ice Age. This temperature 22%. Much of that CO2 increase is attributable to the 6-fold increase change is slight as compared with other natural variations, as shown in human use of hydrocarbon energy. Figures 2, 3, 11, 12, and 13. in Figure 6. Three intermediate trends are evident, including the show, however, that human use of hydrocarbons has not caused the decreasing trend used to justify fears of global cooling in the 1970s. observed increases in temperature. Between 1900 and 2000, on absolute scales of solar irradiance and degrees Kelvin, solar activity Increased , while a C. temperature change is This is in good agreement with estimates that Earth's temperature would be reduced by C.