Transcription of Ethiopia 2019 Ethiopia - Demographic and Health Surveys
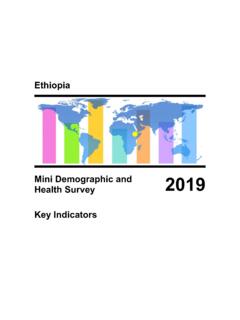
1 Ethiopia mini Demographic and Health survey 2019. FEDERAL DEMOCRATIC REPUBLIC OF Ethiopia . Ethiopia . mini Demographic and Health survey 2019. Ethiopian Public Health Institute Addis Ababa Federal Ministry of Health Addis Ababa The DHS Program ICF. Rockville, Maryland, USA. May 2021. The 2019 Ethiopia mini Demographic and Health survey (2019 EMDHS) was implemented by the Ethiopian Public Health Institute (EPHI), in partnership with the Central Statistical Agency (CSA) and the Federal Ministry of Health (FMoH), under the overall guidance of the Technical Working Group (TWG). Data collection lasted from March to June 2019. Funding for the 2019 EMDHS was provided by the World Bank, the United States Agency for International Development (USAID), and the United Nations Children's Fund (UNICEF). ICF. provided technical assistance through The DHS Program, a USAID-funded project providing support and technical assistance in the implementation of population and Health Surveys in countries worldwide.
2 Additional information about the 2019 EMDHS may be obtained from the Ethiopian Public Health Institute (EPHI), Gulele Arbegnoch Street, Gulele Sub City, Addis Ababa, Ethiopia ; telephone: +251-11-275-4647; fax: +251-11-275-4744; website: Information about The DHS Program may be obtained from ICF, 530 Gaither Road, Suite 500, Rockville, MD. 20850, USA; telephone: +1-301-407-6500; fax: +1-301-407-6501; email: internet: The contents of this report are the sole responsibility of EPHI and ICF and do not necessarily reflect the views of USAID, the United States Government, or other donor agencies. Cover photo: Ethiopian gazelles obviously concerned by the foreign intruder. 2008 Ralf Steinberger, used under Creative Commons CC BY license. Suggested citation: Ethiopian Public Health Institute (EPHI) [ Ethiopia ] and ICF. 2021. Ethiopia mini Demographic and Health survey 2019: Final Report.
3 Rockville, Maryland, USA: EPHI and ICF. CONTENTS. TABLES AND FIGURES .. v FOREWORD .. ix ACKNOWLEDGEMENTS .. xi ACRONYMS AND ABBREVIATIONS .. xiii READING AND UNDERSTANDING TABLES FROM THE 2019 EMDHS .. xv 1 INTRODUCTION AND survey METHODOLOGY .. 1. survey Objectives .. 1. Sample Design .. 1. Questionnaires .. 2. Anthropometry .. 3. Training of Trainers .. 3. Training of Field Staff .. 3. 4. Health Facility Visits .. 4. Data Processing .. 4. Response Rates .. 5. 2 HOUSING CHARACTERISTICS AND HOUSEHOLD POPULATION .. 7. Drinking Water Sources and Treatment .. 7. Sanitation .. 8. Household Wealth .. 9. Other Housing Characteristics .. 10. Household Durable Goods .. 10. Household Status and Resiliency .. 10. Bank Account or Microfinance Account .. 10. Productive Safety Net Programme .. 10. Health Insurance Coverage .. 11. Household Ownership Status.
4 11. Household Population and Composition .. 11. Education .. 12. 3 CHARACTERISTICS OF RESPONDENTS .. 23. Basic Background Characteristics of survey Respondents .. 23. Education and Literacy .. 24. Marital 25. 4 FERTILITY DETERMINANTS .. 29. Children Ever Born and Living .. 29. Birth Intervals .. 29. Age at First Birth .. 30. 5 FAMILY PLANNING .. 37. Contraceptive Knowledge and Use .. 37. Source of Modern Contraceptive Methods .. 39. Contents iii 6 INFANT AND CHILD MORTALITY .. 47. Infant and Child Mortality .. 48. High-risk Fertility Behaviour .. 49. 7 MATERNAL Health CARE .. 55. Antenatal Care Coverage and Content .. 56. Skilled Providers .. 56. Timing and Number of ANC Visits .. 56. Components of ANC .. 57. Delivery 57. Institutional Deliveries .. 57. Skilled Assistance during Delivery .. 58. Delivery by Caesarean Section .. 59. Postnatal Care.
5 59. Postnatal Health Check for Mothers .. 59. Postnatal Health Check for Newborns .. 60. 8 CHILDHOOD VACCINATIONS .. 75. Vaccination of 75. Uptake of the Recently Introduced Vaccines .. 77. Possession and Observation of Vaccination Cards in Households .. 78. Observation of Vaccination Cards in Health Facilities .. 78. 9 NUTRITION OF CHILDREN .. 85. Nutritional Status of 85. Anthropometry Training and Data Collection .. 87. Levels of Child Malnutrition .. 87. Infant and Young Child Feeding Practices .. 88. Early Initiation of Breastfeeding .. 88. Exclusive 89. Median Duration of Breastfeeding .. 90. Introduction of Complementary Foods .. 90. Minimum Dietary Diversity and Minimum Meal Frequency .. 91. Minimum Acceptable Diet .. 92. Micronutrient Intake and Supplementation among 92. Micronutrient Supplementation during Pregnancy .. 93. 103.
6 Appendix A SAMPLE DESIGN .. 105. Introduction .. 105. Sample Frame .. 105. Sample Design and Implementation .. 106. Sample Probabilities and Sampling Weights .. 107. Appendix B ESTIMATES OF SAMPLING ERRORS .. 111. Appendix C DATA QUALITY TABLES .. 129. Appendix D EMDHS CONTRIBUTORS .. 135. Appendix E QUESTIONNAIRES .. 141. iv Contents TABLES AND FIGURES. 1 INTRODUCTION AND survey METHODOLOGY .. 1. Table Results of the household and individual interviews .. 5. 2 HOUSING CHARACTERISTICS AND HOUSEHOLD POPULATION .. 7. Table Household drinking water .. 14. Table Drinking water according to region and wealth .. 15. Table Household sanitation facilities .. 16. Table Sanitation facility type according to region and wealth .. 17. Table Wealth quintiles .. 17. Table Household characteristics .. 18. Table Household 19. Table Household status and resiliency.
7 19. Table Household population by age, sex, and 20. Table Household composition .. 20. Table Educational attainment of the female household population .. 21. Figure Household drinking water by residence .. 8. Figure Household sanitation facilities by residence .. 9. Figure Household wealth by 10. Figure Population pyramid .. 12. 3 CHARACTERISTICS OF RESPONDENTS .. 23. Table Background characteristics of respondents .. 26. Table Educational attainment: Women .. 27. Table Literacy: Women .. 28. Table Current marital status .. 28. Figure Education of survey respondents .. 24. Figure Education of survey respondents by residence .. 24. Figure Marital 25. 4 FERTILITY DETERMINANTS .. 29. Table Children ever born and living .. 33. Table Birth intervals .. 34. Table Age at first birth .. 35. Table Median age at first birth .. 35. Figure Birth intervals.
8 30. Figure Median age at first birth by residence .. 31. Figure Median age at first birth by education .. 31. 5 FAMILY PLANNING .. 37. Table Knowledge of contraceptive methods .. 41. Table Knowledge of contraceptive methods according to background 42. Table Current use of contraception by age .. 43. Table Current use of contraception according to background characteristics .. 44. Table Source of modern contraceptive methods .. 45. Tables and Figures v Figure Contraceptive use .. 38. Figure Trends in contraceptive use .. 38. Figure Use of modern methods by household wealth .. 39. Figure Source of modern contraceptive methods .. 39. 6 INFANT AND CHILD MORTALITY .. 47. Table Early childhood mortality rates .. 51. Table Five-year early childhood mortality rates according to background 51. Table Ten-year early childhood mortality rates according to additional 52.
9 Table High-risk fertility behaviour .. 53. Figure Trends in early childhood mortality rates .. 48. Figure Under-5 mortality by household 49. Figure Childhood mortality by previous birth interval .. 49. 7 MATERNAL Health CARE .. 55. Table Antenatal care .. 62. Table Number of antenatal care visits and timing of first visit .. 63. Table Components of antenatal care .. 64. Table Maternal care indicators .. 65. Table Place of delivery .. 66. Table Assistance during delivery .. 67. Table Caesarean section .. 68. Table Timing of first postnatal check for the 69. Table Type of provider of first postnatal check for the mother .. 70. Table Timing of first postnatal check for the newborn .. 71. Table Type of provider of first postnatal check for the newborn .. 72. Table Content of postnatal care for newborns .. 73. Figure Trends in antenatal care coverage.
10 56. Figure Components of antenatal care .. 57. Figure Trends in place of birth .. 58. Figure Home births by birth order .. 58. Figure Assistance during delivery .. 58. Figure Skilled assistance at delivery by education .. 59. 8 CHILDHOOD VACCINATIONS .. 75. Table Vaccinations by source of information .. 80. Table Vaccinations by background characteristics .. 81. Table Possession and observation of vaccination cards, according to background 82. Table Observation of vaccination history at Health facilities: Children age 0-35 months .. 83. Table Observation of vaccination history at Health facilities: Children age 12-35 months .. 84. Figure Childhood vaccinations .. 76. Figure Trends in childhood vaccinations .. 77. Figure Vaccination coverage by mother's education .. 77. vi Tables and Figures 9 NUTRITION OF CHILDREN .. 85. Table Nutritional status of children.
![Pakistan Demographic and Health Survey 2012-13 [FR290]](/cache/preview/a/3/0/d/7/d/4/3/thumb-a30d7d433902a6b912858b3567e7005a.jpg)
![Ethiopia Demographic and Health Survey 2016 [FR328]](/cache/preview/b/4/6/c/8/f/a/7/thumb-b46c8fa7d3e1cb3435d90bf577845b98.jpg)

![Swaziland Demographic and Health Survey 2006-07 [FR202]](/cache/preview/e/9/6/6/b/1/5/2/thumb-e966b152d2377b66a5a36be0eaa2b17b.jpg)


![Gender Equality and Women's Empowerment in India [OD57]](/cache/preview/0/7/f/d/9/7/1/6/thumb-07fd97166dd92c7359501888c42037d3.jpg)

