Transcription of Euclidean Distance - Paul Barrett's Homepage
1 September, 2005 Euclidean Distanceraw, normalized, and double scaled coefficientsf 2of 26 Technical Whitepaper #6: Euclidean distanceSeptember, 2005 Euclidean Distance Raw, Normalised, and Double Scaled Coefficients Having been fiddling around with Distance measures for some time especially with regard to profile comparison methodologies, I thought it was time I provided a brief and simple overview of Euclidean Distance and why so many programs give so many completely different estimates of it. This is not because the concept itself changes (that of linear Distance ), but is due to the way programs/ investigators either transform the data prior to computing the difference, normalise constituent distances via a constant, or re scale the coefficient into a unit metric. However, few actually make absolutely explicit what they do, and the consequences of whatever transformation they undertake. Given that I always use a double scaling of Distance into a unit metric for the coefficient, and never transform the raw data, I thought it time I explained the logic of this, and why I feel some of the coefficients used within some popular statistical programs are sometimes less than optimal ( using normal z score transformations).
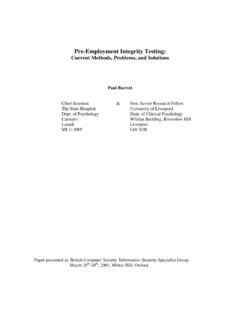
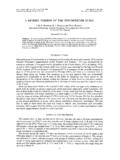
2 Raw Euclidean Distance The Euclidean metric (and Distance magnitude) is that which corresponds to everyday experience and perceptions. That is, the kind of 1, 2, and 3 Dimensional linear metric world where the Distance between any two points in space corresponds to the length of a straight line drawn between them. Figure 1 shows the scores of three individuals on two variables (Variable 1 is the x axis, Variable 2 the y axis) Figure 1 Variable 2 Variable 12050802050803070100 Person_1 Person_240603070 Person 1-2euclideandistancePerson 2-3euclideandistance4060 Person_3 Person 1-3euclideandistancef 3of 26 Technical Whitepaper #6: Euclidean distanceSeptember, 2005 The straight line between each Person is the Euclidean Distance . There would this be three such distances to compute, one for each person to person Distance . However, we could also calculate the Euclidean Distance between the two variables, given the three person scores on each as shown in Figure 2.
3 Figure 2 The formula for calculating the Distance between each of the three individuals as shown in Figure 1 is: Eq. 1 2121()viiidpp where the difference between two persons scores is taken, and squared, and summed for v variables (in our example v=2). Three such distances would be calculated, for p1 p2, p1 p3, and p2 p3. The Euclidean Distance between 2 variablesin the 3-person dimensional score space Variable 1 Variable 2f 4of 26 Technical Whitepaper #6: Euclidean distanceSeptember, 2005 The formula for calculating the Distance between the two variables, given three persons scoring on each as shown in Figure 1 is: Eq. 2 2121()piiidvv where the difference between two variables values is taken, and squared, and summed for p persons (in our example p=3). Only one Distance would be computed between v1 and v2. Let s do the calculations for finding the Euclidean distances between the three persons, given their scores on two variables.
4 The data are provided in Table 1 below .. Table 1 Using equation 1 .. 2121()viiidpp For the Distance between person 1 and 2, the calculation is: 22(20 30)(80 44) For the Distance between person 1 and 3, the calculation is: 22(20 90)(80 40) For the Distance between person 2 and 3, the calculation is: 22(30 90)(44 40) 1 Var12 Var2 Person 1 Person 2 Person 320 8030 4490 40f 5of 26 Technical Whitepaper #6: Euclidean distanceSeptember, 2005 Using equation 2, we can also calculate the Distance between the two variables .. 2121()piiidvv 222(20 80)(30 44)(90 40) Equation 1 is used where say we are comparing two objects across a range of variables and trying to determine how dissimilar the objects are (the Euclidean Distance between the two objects taking into account their magnitudes on the range of variables. These objects might be two person s profiles, a person and a target profile, in fact basically any two vectors taken across the same variables.)
5 Equation 2 is used where we are comparing two variables to one another given a sample of paired observations on each (as we might with a pearson correlation), In our case above, the sample was three persons. In both equations, Raw Euclidean Distance is being 6of 26 Technical Whitepaper #6: Euclidean distanceSeptember, 2005 Normalised Euclidean Distance The problem with the raw Distance coefficient is that it has no obvious bound value for the maximum Distance , merely one that says 0 = absolute identity. Its range of values vary from 0 (absolute identity) to some maximum possible discrepancy value which remains unknown until specifically computed. Raw Euclidean Distance varies as a function of the magnitudes of the observations. Basically, you don t know from its size whether a coefficient indicates a small or large Distance . If I divided every person s score by 10 in Table 1, and recomputed the Euclidean Distance between the persons, I would now obtain Distance values of for person 1 compared to 2, instead of Likewise, for person 1 and 3, and for persons 2 and 3.
6 The raw Distance conveys little information about absolute dissimilarity. So, raw Euclidean Distance is acceptable only if relative ordering amongst a fixed set of profile attributes is required. But, even here, what does a figure of actually convey. If the maximum possible observable Distance is 38, then we know that the persons being compared are about as different as they can be. But, if the maximum observable Distance is 1000, then suddenly a value of seems to indicate a pretty good degree of agreement between two persons. The fact of the matter is that unless we know the maximum possible values for a Euclidean Distance , we can do little more than rank dissimilarities, without ever knowing whether any or them are actually similar or not to one another in any absolute sense. A further problem is that raw Euclidean Distance is sensitive to the scaling of each constituent variable. For example, comparing persons across variables whose score ranges are dramatically different.
7 Likewise, when developing a matrix of Euclidean coefficients by comparing multiple variables to one another, and where those variables magnitude ranges are quite different. For example, say we have 10 variables and are comparing two person s scores on them .. the variable scores might look like .. Table 2 1 Person 12 Person 2 Var 1 Var 2 Var 3 Var4 Var5 Var6 Var7 Var8 Var9 Var1012114566120013003322352388f 7of 26 Technical Whitepaper #6: Euclidean distanceSeptember, 2005 The two persons scores are virtually identical except for variable 5. The raw Euclidean Distance for these data is: If we had expressed the scores for variable 5 in the same metric as the other scores (on a 1 10 metric scale), we would have scores of and respectively for each individual. The raw Euclidean Distance is now: Obviously, the question is good or bad still exists given we have no idea what the maximum possible Euclidean Distance might be for these data. This is where SYSTAT, Primer 5, and SPSS provide Standardization/Normalization options for the data so as to permit an investigator to compute a Distance coefficient which is essentially scale free.
8 Systat s normalised Euclidean Distance produces its normalisation by dividing each squared discrepancy between attributes or persons by the total number of squared discrepancies (or sample size). Eq. 3 2121()viiippdv So, comparing two persons across their magnitudes on 10 variables, as in the Table 3 below, Table 3 1 Person 12 Person 2 Var 1 Var 2 Var 8of 26 Technical Whitepaper #6: Euclidean distanceSeptember, 2005 We calculate .. 22 For the data in Table 2, the SYSTAT normalized Euclidean Distance would be Frankly, I can see little point in this standardization as the final coefficient still remains scale sensitive. That is, it is impossible to know whether the value indicates high or low dissimilarity from the coefficient value alone. f 9of 26 Technical Whitepaper #6: Euclidean distanceSeptember, 2005 Primer 5 an ecological/marine biology software package allows the calculation of raw Euclidean Distance as well as a normalized Euclidean Distance .
9 But, this normalization is problematic when just two variables or persons are to be compared to one another and these are the only two persons or variables in the dataset. An immediate problem is encountered when trying to analyse the data in Tables 2 or 3 causes an error message This is due to the fact that Primer 5 is actually standardizing each row of data in the file .. hence, when two values are equal, as for variables 2, 4, 6, 7 etc., there is no variance, no standard deviation or it is set to zero, which then causes a division by zero in the standardization formula. I modified the data in Table 3 to allow unequal values on each pair of variable scores for the two persons .. Table 4 What we see in columns 3 and 4 is what Primer 5 does with the data (by standardizing rows) .. It produces a normalized Euclidean Distance calculation of for the data in columns 1 and 2. The raw Euclidean Distance is If we change variable 5 to reflect the 1200 and 1300 values as in Table 2, the normalized Euclidean Distance remains as , whilst the raw coefficient is: So, its normalization certainly ensures stability of coefficient scaling given unequal metrics of the constituent variables, but the value itself is 1 Person 12 Person 23 Person 1 - RowStandardized4 Person 2 - RowStandardizedVar 1 Var 2 Var 10of 26 Technical Whitepaper #6: Euclidean distanceSeptember, 2005 now a function of the number of variables.
10 For example, if we had made the calculation over 500 variables, the normalized Euclidean Distance would be The reason for this is because whatever the values of the variables for each individual, the standardized values are always equal to ! Look at the following data in Table 5 below .. Table 5 The raw Euclidean Distance is , the Primer 5 normalized coefficient remains at It s clear that Primer 5 cannot provide a normalized Euclidean Distance where just two objects are being compared across a range of attributes or samples. It seems to work only where more than two objects exist in a data matrix, and more than two variables or samples are present. Then the standardization permits differentiation of values for samples or variables such that coefficients may be calculated. As a double check I added a 3rd person to the data of Table 5, shown in Table 6 .. Table 6 1 Person 12 Person 23 Person 1 - RowStandardized4 Person 2 - RowStandardizedVar 1 Var 2 Var Stats Corner document test data file 1 Person 12 Person 23 Person 3 Var 1 Var 2 Var 3 Var4 Var5 Var6 Var7 Var8 Var9 Var1012 41244452365561200 1300 10003434235635 223 387 7 Euclidean Stats Corner document test data file 1 Row Std Person 12 Row Std Person 23 Row Std Person 11of 26 Technical Whitepaper #6: Euclidean distanceSeptember, 2005 The Row Standardized values for each variable are shown as the last 3 variables.