Transcription of A REVISED VERSION OF THE PSYCHOTICISM SCALE
1 Person. individ. Difl Vol. 6. No. 1. pp. 21-29, 1985 Printed in Great Britain. All rights reserved 0191L8869/85 $ + Copyright 0 1985 Pergamon Press A REVISED VERSION OF THE PSYCHOTICISM SCALE S. B. G. EYSENCK, H. J. EYSENCK and PAUL BARRETT Department of Psychology, Institute of Psychiatry, De Crespigny Park, Denmark Hill, London SE5 8AF, England (Received 28 June 1984) Summary-In view of certain psychometric deficiencies of the original PSYCHOTICISM SCALE , an attempt was made to improve the SCALE by adding new items. It was attempted to increase the internal reliability of the SCALE , improve the shape of the distribution and increase the mean and variance score.
2 Two different studies are discussed. Reliabilities are now somewhat improved, distributions are closer to normal and mean scores are higher than on the old SCALE . Four new short 12-item scales for the measurement of P, E, N and L are also given. INTRODUCTION The publication of PSYCHOTICISM as a Dimension of Personality (Eysenck and Eysenck, 1976) and the Eysenck Personality Questionnaire (EPQ; Eysenck and Eysenck, 1975) was accompanied by numerous criticisms of the psychometric properties of the P SCALE (Block, 1977a, b; Bishop, 1977) as well as other aspects of the concept itself; some of these were answered by Claridge and Birchall (1978), Eysenck (1977) and Eysenck and Eysenck (1977).
3 A summary of the available evidence to date on all the points has been presented by Claridge (1981), and there is no intention here to discuss these issues any further. Our intention is to try and improve what are undoubtedly psychometric weaknesses in the P SCALE of the EPQ, by designing new items, based on the development of the original concept, testing the relevance of these items by new factor-analytic studies and construct improved questionnaires in the hope of improving upon the original VERSION of the P SCALE . There are three major faults in the original P SCALE which, while not apparently interfering too much with its validity in group comparisons, made individual application rather hazardous.
4 The first of these faults is the low reliability of the SCALE , for males and for females. (These are internal reliabilities; test-retest reliabilities are rather higher, viz. and ) The second fault is the low range ofscoring, with means of for males and for females. The fact that standard deviations were almost identical with means ( and ) indicates the third fault, namely the grossly skewed distribution of scores, which almost resembled a Poissonian distribution. The fact that in spite of these faults the SCALE was found to behave very consistently and predictably (Claridge, 1981) suggests that the validity was not depressed too much by these psychometric faults, but clearly improvements should be made if possible.
5 SAMPLES AND METHODS Two studies were, in fact, carried out to this end. The first (A) used a 90-item questionnaire which contained the EPQ P SCALE plus possible new P items, together with 12 E and 13 N items selected from the EPQ. There were no L- SCALE items. The sample tested consisted of 384 males and 290 females, whose ages ranged from 17 to 70 yr, their respective age means being _+ and f yr. Sample A was collected by random approach in the street and by house-to- house circulation of questionnaires. The second sample (B) used a 117-item questionnaire which contained all the 90 items of the EPQ plus almost all the possible new P items used for the questionnaire of Study A.
6 This sample was collected in a more orthodox manner, with groups of students, teachers and other willing and varied Ss being approached to complete the questionnaire and returned by post. There were 408 males and 494 females aged + and + yr, respectively, the range being the same as in Study A. 21 22 S. EYSENCK et al. In both studies the items were intercorrelated separately for males and females and the resulting matrices factor-analysed by principal components. In Study A, three factors were extracted and rotated through Varimax and then Promax, these being identified as P, E and N. In Study B, however, four factors were extracted and were similarly rotated using Direct Oblimin rotation.
7 These were clearly identified as P, E, N and the L SCALE . Both sets of loadings were scrutinized for suitable P items to improve the original SCALE . Table 1 gives the 32 items which were finally chosen to make up the P SCALE of the EPQ- REVISED (EPQ-R). It will be seen that only the P loadings are given for Sample A, but all P, E, N and L loadings are given for Sample B. This is because of the few E and N items in Study A, and the complete absence of L items. Table 1. Factorloadingson Pfor Sample Aand on P, L for SampleB foritemson EPQ-R No. on EPQ-R -2 -5 -1 -9 -12 -14 -18 -21 2s 29 30 34 37 -41 42 48 50 -54 56 -59 -64 -68 73 75 -79 -81 -85 -88 91 95 -96 Samp.
8 E A (II = 290) MALES FEMALES P P Sample B (n = 408) E Sample A 01 = 384) N L P P 031 -026 -034 -017 011 -046 -036 Sample B (II = 494) F N L -003 RESULTS Although Sample A were somewhat older than Sample B (especially the females), and the collection of the data was somewhat different, the P- SCALE means and standard deviations were pooled.
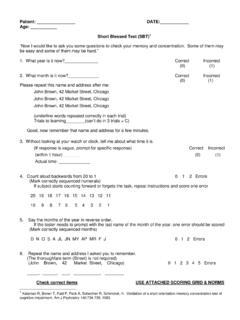
9 These are given, for different age groups, in Table 2 and contain Ss from Samples A and B combined for P, but only from Sample B for E, N and L. However, just as a matter of interest, Table 3 gives the actual means and standard deviations on P obtained by each of the age groups in Samples A and B, respectively. The scoring key on which these means were calculated is given in Table 4, the item numbers referring to questions on the 100 item EPQ-R given in Appendix 1. There are now 32 items on the new P SCALE , 7 more than in the EPQ P SCALE and very slight changes to E and N were made so that the former has 23 and the latter 24 items, leaving L with the original 21 items.
10 The total number of items, therefore, is now 100. A REVISED VERSION of the P SCALE Table 2. Means and standard deviations of P, E. N and L for different age groups on the EPQ-R 23 Age Samples A + B P E Sample B N L 16-20 120 21-30 148 3140 117 41-50 107 5160 110 61-70 91 Total 693 16-20 203 21-30 256 3140 135 41-50 109 514 102 61-70 73 Total 878 B SD n 108 64 53 55 69 59 408 r Males SD K SD x SD Females 161 159 38 50 45 41 494 Table 3. Means and standard deviations for the P SCALE only for Samples A, B and (A + B) combined Age Sample B Sample A Samples B + A group (yr) n li SD n F SD n x SD 16-20 108 1 21-30 64 3140 53 41-50.
