Transcription of Executive Summary
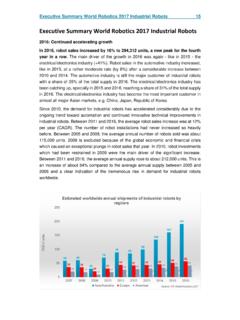
1 Executive Summary world Robotics 2018 Industrial Robots 13. Executive Summary world Robotics 2018 Industrial Robots Robot Sales 2017: Impressive growth In 2017, robot sales increased by 30% to 381,335 units, a new peak for the fifth year in a row. The main drivers of this exceptional growth in 2017 were the metal industry (+55%) and electrical/electronics industry (+33%). Robot sales in the automotive industry increased by 22% and remained still the major customer of industrial robots with a share of 33% of the total supply in 2017. The electrical/electronics industry has been catching up, especially since 2015.
2 In 2017, it reached almost the same share of total supply (32%). The electrical/electronics industry became the most important customer in almost all major Asian markets, China, Japan, Republic of Korea, already in 2016. Since 2010, the demand for industrial robots has accelerated considerably due to the ongoing trend toward automation and continued innovative technical improvements in industrial robots. Between 2012 and 2017, the average robot sales increase was at 19%. per year (CAGR). The number of robot installations had never increased so strongly before. Between 2005 and 2008, the average annual number of robots sold was about 115,000 units.
3 2009 however, was not an ordinary year because of the global economic and financial crisis which caused an exceptional plunge in robot sales that year. In 2010, investments which had been restrained in 2009 were the main driver of the significant increase in robot sales. Between 2011 and 2017, the average annual supply doubled to about 236,000 units compared to the average annual supply between 2005 and 2008. In the past three years (2015-2017) the average annual increase was about 310,000 units. This is a clear indication of the tremendous, accelerating rise in demand for industrial robots worldwide.
4 14 Executive Summary world Robotics 2018 Industrial Robots Continued considerable increase in all regions Asia1 is still the world 's strongest growth market. With a total of about 261,800 units sold in 2017, a rise of 37% more than the global sales volume of 2015 (253,300) was reached in this region. This was the highest sales level ever recorded for the fifth year in a row. Between 2012 and 2017, robot installations rose by an average annual rate of 25%. Industrial robot sales in the second largest market, Europe, increased by 18% to almost 66,300 units (a new peak, for the fith year in a row) and an annual average increase rate of 10% between 2012 and 2017, like in the Americas.
5 About 46,100 industrial robots were shipped to the Americas, 12% more than in 2016, establishing a new peak for the sixth year in a row. 73% of the global robot sales in five countries There are five major markets representing 73% of the total global sales volume in 2017: China, Japan, the Republic of Korea, the United States and Germany. Since 2013. China has been the biggest robot market in the world with a continued dynamic growth. China has significantly expanded its leading position as the biggest market with a share of 36% of the total supply in 2017 (30% in 2016).
6 About 137,900 industrial robots were sold to China in 2017, 59% more than in 2016. This was considerably more than the total sales volume of Europe and the Americas together (112,400 units). About 34,700 units of robots were sold by Chinese robot manufacturers in China according to the information from the China Robot Industry Alliance (CRIA). Their sales volume was about 29%. higher than in 2016 (27,000 units). Foreign robot suppliers increased their sales by 72%. to 103,200 units, including robots produced locally by the international robot suppliers in China. This is the first time that the foreign robot suppliers have a higher growth rate than the local ones.
7 The market share of the Chinese robot suppliers decreased from 31% in 2016 to 25% in 2017. (For more details see chapter ). In 2017, robot sales in Japan increased by 18% to 45,566 units, representing the second highest value ever observed for this country. Only in the year 2000 a higher value (46,986. units) was recorded. Main driver of the growth in 2017 was the electrical/electronics industry, while the automotive industry remained at previous year's level. Between 2012. and 2017, robot sales increased by 10% on average per year (CAGR). (For more details see chapter ).
8 Robot supplies in the Republic of Korea decreased by 4% to 39,732 units in 2017. The year before, industrial robot installations peaked at 41,373 units. The main driver of this development is the electrical/electronics industry that reduced robot installations by 18%. in 2017. Between 2012 and 2017, robot sales increased by 15% on average per year (CAGR) in the Republic of Korea. (For more details see chapter ). Robot installations in the United States continued to increase to a new peak in 2017 . for the seventh year in row - (33,192 units), 6% higher than in 2016. Since 2010, the driver of the growth in all manufacturing industries in the has been the ongoing trend 1.
9 Australia and New Zealand included in the category Executive Summary world Robotics 2018 Industrial Robots 15. to automate production in order to strengthen the US-industries in both domestic and global markets. (For more details see chapter ). Germany is the fifth largest robot market in the world . In 2017, the number of robots sold increased by 7% to 21,404 units - a new peak - compared to 2016 (20,074 units). Between 2014 and 2016, annual sales of industrial robots stagnated at around 20,000. units. (For more details see chapter ). Other important Asian markets Since 2013, Taiwan has ranked sixth among the most important robot markets in the world regarding the annual supply.
10 Robot installations increased considerably between 2012 and 2017, by 26% on average per year (CAGR). In 2017, robot sales surged by even 44% to about 10,900 units, a new peak. In 2017, Vietnam became the seventh largest robot market in the world . Robot sales jumped from about 1,600 units in 2016 to almost 8,300 units in 2017. The driver of the growth was the electrical/electronic industry. The electronics industry is also responsible for the significant increase of robot sales in Singapore in 2017, +72% to about 4,500 units. After decreasing in recent years, robot sales in Thailand were up by 28% to 3,400 units in 2017.
