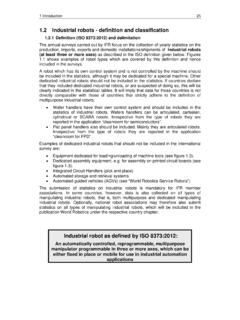
Transcription of World Robotics 2017 - International Federation of …
1 Executive Summary World Robotics 2017 industrial Robots 15 Executive Summary World Robotics 2017 industrial Robots 2016 : Continued accelerating growth In 2016 , robot sales increased by 16% to 294,312 units, a new peak for the fourth year in a row. The main driver of the growth in 2016 was again - like in 2015 - the electrical/electronics industry (+41%). robot sales in the automotive industry increased, like in 2015, at a rather moderate rate (by 6%) after a considerable increase between 2010 and 2014. The automotive industry is still the major customer of industrial robots with a share of 35% of the total supply in 2016 . The electrical/electronics industry has been catching up, specially in 2015 and 2016 , reaching a share of 31% of the total supply in 2016 . The electrical/electronics industry has become the most important customer in almost all major Asian markets, China, Japan, Republic of Korea. Since 2010, the demand for industrial robots has accelerated considerably due to the ongoing trend toward automation and continued innovative technical improvements in industrial robots.
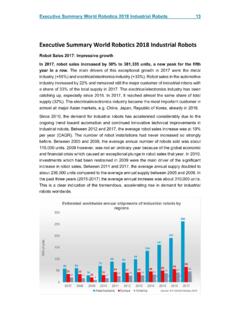
2 Between 2011 and 2016 , the average robot sales increase was at 12% per year (CAGR). The number of robot installations had never increased so heavily before. Between 2005 and 2008, the average annual number of robots sold was about 115,000 units. 2009 is excluded because of the global economic and financial crisis which caused an exceptional plunge in robot sales that year. In 2010, robot investments which had been restrained in 2009 were the main driver of the significant increase. Between 2011 and 2016 , the average annual supply rose to about 212,000 units. This is an increase of about 84% compared to the average annual supply between 2005 and 2008 and a clear indication of the tremendous rise in demand for industrial robots worldwide. 16 Executive Summary World Robotics 2017 industrial Robots Continued considerable increase in all regions Asia16 is still the World 's strongest growth market.
3 This region saw a total of 190,492 units sold in 2016 a rise of 19%. This was the highest sales level ever recorded for the fourth year in a row. industrial robot sales in the second largest market, Europe, increased by 12% to 56,000 units (a new peak, for the third year in a row). About 41,300 industrial robots were shipped to the Americas, 8% more than in 2015, establishing a new peak for the fifth year in a row. 74% of the global robot sales in five countries There are five major markets representing 74% of the total sales volume in 2016 : China, the Republic of Korea, Japan, the United States, and Germany. Since 2013 China has been the biggest robot market in the World with a continued dynamic growth. China has significantly expanded its leading position as the biggest market with a share of 30% of the total supply in 2016 (27% in 2015). With sales of about 87,000 industrial robots in 2016 an increase of 27% compared to 2015 - China came close to the total sales volume of Europe and the Americas together (97,300 units).
4 Chinese robot suppliers continued to expand their market share from 25% in 2013 to 31% in 2016 . Between 2011 and 2016 , total supply of industrial robots increased by about 31% per year on average. (For more details see chapter ) About 41,400 units (8% more than in 2015) were sold to the Republic of Korea, the second biggest market. Due to major investments of the electrical/electronics industry in robots, annual sales increased considerably in 2016 . Between 2011 and 2016 , robot sales increased by 10% on average per year (CAGR). (For more details see chapter ) In 2016 , robot sales in Japan increased by 10% to about 38,600 units, reaching the highest level since 2006 (37,400 units). robot sales in Japan followed a decreasing trend between 2005 (reaching the peak at 44,000 units) and 2009 (sales dropping to only 12,767 units). Between 2011 and 2016 , robot sales increased by 7% on average per year (CAGR).
5 (For more details see chapter ) Increase in robot installations in the United States continued in 2016 , by 14%, to the peak of 31,400 units. Driver of this continued growth since 2010 was the ongoing trend to automate production in order to strengthen American industries on the global market and to keep manufacturing at home, and in some cases, to bring back manufacturing that had previously been sent overseas. (For more details see chapter ) Germany is the fifth largest robot market in the World . In 2016 , the number of robots sold increased slightly to 20,039 units compared to 2015 (19,945 units). Between 2011 and 2016 , annual sales of industrial robots more or less stagnated at around 20,000 units. (For more details see chapter ) 16 Australia and New Zealand included in the category Executive Summary World Robotics 2017 industrial Robots 17 Other important Asian markets Since 2013, Taiwan has ranked sixth among the most important robot markets in the World regarding the annual supply.
6 robot installations increased considerably between 2011 and 2016 , by 15% on average per year (CAGR). In 2016 , robot sales increased by 5% to about 7,600 units, a new peak. Thailand is also a growing robot market in Asia. However, sales have declined since 2014 reaching 2,646 units in 2016 . The peak was reached in 2012 with about 4,000 units. robot sales increased by 27% to a new peak of 2,627 units in India, almost the same level as in Thailand. robot supplies to other Southeast Asian countries like Vietnam, Singapore and Malaysia substantially increased in 2016 . (For more details see chapter ) Other important European markets Italy has ranked 7th since 2014 regarding the worldwide annual supply of industrial robots. robot investments were slightly down in 2016 from the peak of 6,700 units in 2015. The French robot market was up by 39% to a new peak level. In Spain, sales of industrial robots rather moderately increased to a new peak of 3,900 units.
7 Sales of industrial robots in the United Kingdom increased for the first time since 2012. robot installations in all other Western European and in all Nordic countries were significantly up in 2016 , as in 2015. Sales in most Central and Eastern European markets also increased, except in the Czech Republic and Poland. Sales in Turkey continued to increase in 2016 . (For more details see chapter ) Other important American markets Mexico has become an important emerging market for industrial robots. robot sales further increased to about 5,900 units in 2016 , again a new peak. In Canada, robot sales were down from the peak of about 3,500 units in 2015 to 2,300 units in 2016 . robot sales in Brazil decreased in 2016 . (For more details see chapter ) Main driver of the growth: electrical/electronics industry Between 2010 and 2014, the automotive industry the most important customer of industrial robots considerably increased investments in industrial robots worldwide.
8 In 2015 and in 2016 , robot sales further increased but at a lower rate. In 2016 , robot demand of the automotive industry increased by 6% to a new peak of 103,300 units, accounting for a share of 35% of the total supply in 2016 . Between 2011 and 2016 , robot sales to the automotive industry increased by 12% on average per year (CAGR). Since 2010, investments in new production capacities in the emerging markets as well as investments in production modernization in major car producing countries have caused the number of robot installations to rise. Using new materials, developing energy efficient drive systems, as well as high competition in all major car markets, pushed for investments despite the existing overcapacities. 18 Executive Summary World Robotics 2017 industrial Robots robot sales to the electrical/electronics industry (including computers and equipment, radio, TV and communication devices, medical equipment, precision and optical instruments) were significantly up since 2013.
9 In 2016 , sales increased by 41% to a new peak of 91,300 units, accounting for a share of 31% of the total supply in 2016 . Between 2011 and 2016 , the average annual growth rate was 19%. The rising demand for electronic products and new products, the need to automate production and the increasing need for batteries, chips and displays, were driving factors for the boost in sales. The production facilities are mainly in Asian countries. In 2016 , sales to the metal and machinery industry slightly decreased by 3% to 28,700 units, down from the peak of 29,450 units in 2015. Since 2010, sales of all subsectors (basic metals, metal products, industrial machinery) have followed an increasing trend. Between 2011 and 2016 , the average annual growth rate was 15%. The rubber and plastics industry has continuously increased the number of robot installations since 2009 from about 5,800 units to 17,300 units in 2015, a new peak.
10 In 2016 , sales declined by 8% to 16,000 units. Share of the total supply in 2016 was about 5%. Between 2011 and 2016 , sales were up by 9% on average per year. The food and beverage industry also increased robot orders in 2016 by 20% to almost 8,200 units, accounting for a share of 3% of the total supply. Sales continuously increased between 2010 and 2014, but it decreased in 2015. The annual average growth rate between 2011 and 2016 was 12%. Sales to all industries, except for automotive and electrical/electronics, increased by 5% in 2016 . Between 2011 and 2016 , the average growth rate per year was 13%. The respective growth rate for the automotive industry was 12% and for the electrical/electronics industry 19%. This is a clear indication that not only the main customer industries (automotive industry and electrical/electronics industry) have substantially increased robot installations in recent years, but other industries have done so as well.