Transcription of Experiment 4 Analysis by Gas Chromatography
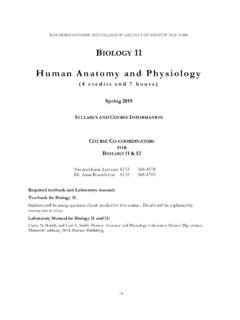
1 Experiment 4. Analysis by Gas Chromatography In this Experiment we will study the method of gas Chromatography . Gas Chromatography (GC) is one of the most important analytical tools that the chemist has. In this lab you will watch and listen to a video presentation about GC, look at a research-level GC instrument, and learn how to do a qualitative and quantitative GC Analysis . A schematic outline of a typical instrument is shown below. When a sample is injected into the correct column, a carrier gas sweeps the sample through the column. If necessary, an oven heats the system to vaporize the sample and speed its passage through the column. The different components of the sample will be separated by the column because each of the components sticks to the liquid coating that on the column packing differently. The greater the stickiness, the longer it takes for a substance to pass through the column.
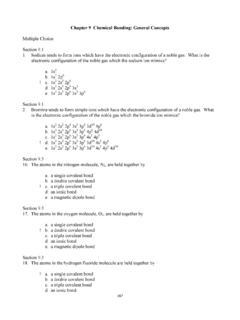
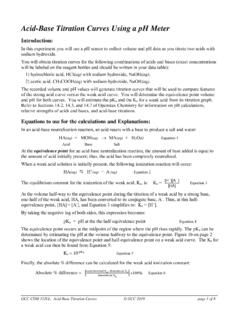
2 When a substance leaves the column, it is sensed by a detector. The detector generates a voltage that is proportional to the amount of the substance. The signal from the detector is then displayed by a chart recorder and/or fed into a computer. Modern gas chromatographs are connected to a computer which displays the peaks of all the substances in the sample. This is called the chromatogram. Software can perform all the calculations you will do in this Experiment . An example of an Analysis for cholesterol esters is shown above. If it could be done at all, this separation would take weeks by traditional wet chemistry. Here it took 21 min for the Analysis and a few hours to prepare the sample for injection into the chromatograph. However, so that you can understand how the computer does its Analysis , we will supply you with peaks drawn by a chart recorder and you will perform all the measurements and calculations.
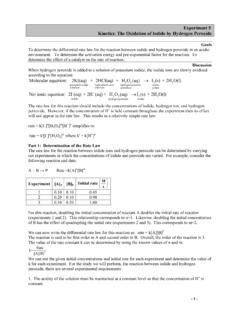
3 The kind of signal displayed by a chart recorder is more-or-less a triangular shaped peak. This is because the detector signal causes a vertical deflection of the recorder pen at the same time that the chart paper is moving under the pen The time that it takes a substance to pass through the instrument from injection to detection is called the retention time, tr. The retention time, tr, is measured from the injection point to the peak height. The peak height is the highest point of the peak and is the only reproducible point on the peak. Since the chart paper moves at a constant speed, the box divisions are proportional to tr and you can measure tr in box divisions for this Experiment . The amount of substance in a sample is proportional to the area under the peak of that substance. However, the proportionality constant is different for each substance and detector. Therefore, to do quantitative Analysis 21.
4 By gas Chromatography , you must first determine the proportionality constant for each substance in the sample. You will do this by constructing calibration lines as described below. There is another piece of information that you need in order to do quantitative GC Analysis . This is the attenuation (attn). Since most signals from the detector are too large for the recorder mechanism to handle, there is a switch on the chromatograph that attenuates or reduces the size of the signal. For example, if the attenuation of a peak is 512, the signal has been reduced 512 times. So you must multiply the area under the peak (the area that you measure on the chart) by 512 to get the true area that is proportional to the original signal. Thus, it is area x attn that is proportional to the amount of substance injected. You will be given a packet in lab that contains copies of GC chart recordings of the following four compounds: There are two kinds of information available on the recordings in the packet.
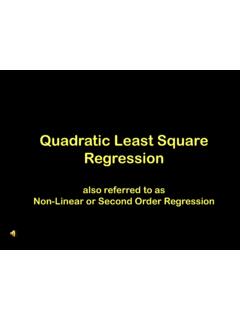
5 1. The retention times of each substance as determined from the distance in box units between the injection point and peak of each curve. As stated above, we will use box units for retention times because they are proportional to the time and serve us just as well. 2. The peak areas corresponding to injection of different amounts of each pure substance. You are given a number of peaks (usually 7 or 8) for each pure compound made by varying the quantity (in microliters, L). injected, and the attenuation setting for each peak. You are to plot a calibration line for each substance using Vernier's Graphical Analysis program. You will then perform a linear regression on each line to determine the slope and y-intercept of the line. After the calibration lines are plotted and approved by the instructor, you will be given the chromatogram of an unknown mixture to identify. By determining the retention time of each peak of the unknown, you can identify the substance that the peak corresponds to.
6 By measuring the area x attn of each peak, you can use the formula of a straight line (y = mx + b) from the calibration line to determine how much of each substance was Retention Times and Preparing calibration Graphs On the chromatogram of all the pure substances (the last page of the packet you will be given in lab), measure the retention time of each peak in box units, to the nearest box units, and record it directly on the graph near the peak. For each peak, the retention time is measured from the injection point to the top of the peak as shown below. Transfer the values to Data Table Retention Times. start tr Open Graphical Analysis . Using Graphical Analysis , you will plot the area x attn on the vertical axis (the y- axis) and the microliters ( L) injected on the horizontal axis (the x-axis). A separate graph will be prepared for each substance. You will end up with four separate graphs containing four straight lines, one for each substance.
7 These will be your calibration lines. Using Graphical Analysis to Plot Your Data 1. Enter the data into the Data Table Window. You can move from one cell to another by hitting the Enter 23. button on your keyboard, or by using the mouse to click on the cell. Microliter ( L) values are entered in the column labeled x. Area x attn values are entered in the column labeled y. Since the area x attn numbers are very large, they should all be converted to scientific notation and then changed so that all the numbers have the same exponent. Choose this one exponent so that all the number parts are larger than 1 but otherwise as small as possible. Then you can just plot the number part (the abcissa) and note the exponent (the ordinate). on the y-axis label. Suppose two of your numbers are 35,600 = x 104 and 274,000 = x 105. For plotting purposes, you would write them as x 104 and x 104 and only plot and 2.
8 Click on the graph's title and change the title to the name of the substance plotted. For example, the first graph will probably be called Benzene or even better, calibration Line for Benzene. At this point, you should sort the data so it is listed from the smallest volume to the largest volume. This is so the entries in the Data Table Window are easy to read. Do this as follows: Make the Data Table Window active by clicking on it. Then Data Sort Data Volume OK. 3. Double click on the x in the Data Table Window and change the axis label. Label the x-axis volume injected with units of L. Now label the y-axis by double clicking on the y in the Data Table Window. For the numbers shown in #1 above, you would label the y-axis area x attn x E 4 in units of boxes. (You can't enter exponents in a graph title or an axis label in this program, so use E 4 to mean 10 4. The E stands for exponent, in this case 10.)
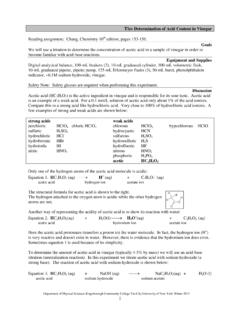
9 The reason the exponent is 10 4 and not 10+4 is that you multiplied the original numbers by 10 4 to get the numbers written on the y-axis. This is the convention that is used in scientific journals. 4. Make the graph the active window by clicking any place in the graph. Remove the connecting line on the graph by un-checking Connecting Lines in the Graph menu. Perform a linear regression on each graph in the following way: In the Analyze menu, select Curve Fit. Choose Linear in the resulting window, and then click try fit and then OK. Move the regression box on the graph away from the line so the line and the points are not covered. Do this by placing the cursor anyplace in the regression box, and while holding down the left mouse button, move the mouse to reposition the box. A. typical calibration graph for benzene is shown above. 5. Print each data table and calibration graph in the following way: First fill in the Text Box on the screen with your name, course, section, name of lab Experiment , and date.
10 Generally, the landscape orientation is preferable to portrait. Landscape can be selected in page setup menu under file. Choose Printer Setup in the File menu. Choose the correct printer for your lab as directed by your instructor. Click OK. Then choose Print in the File menu. 6. Saving your data: Insert a formatted 3 in. floppy disk into the a: drive. In the File menu, click on Save As. In the Save Data As window, and then in the Filename: box, erase any existing file name and type in your file name, such as GC benzene. Then click OK. You have now saved the graph for benzene. Save the 3 other graphs in a similar way. Show your calibration graphs to your instructor who will then give you a GC recording of an unknown. Analyzing Your Unknown Determine the retention time in box units of each peak in the unknown. Identify each substance present by comparison with the retention times of the substances contained in the chromatogram of all the pure substances.