Transcription of EXPERIMENTAL MODAL ANALYSIS - maintenance.org
1 CSI Reliability Week, Orlando, FL October, 1999 Page 1 of 12 EXPERIMENTAL MODAL ANALYSIS By Brian J. Schwarz & Mark H. Richardson Vibrant Technology, Inc. Jamestown, California 95327 ABSTRACT EXPERIMENTAL MODAL ANALYSIS has grown steadily in popu-larity since the advent of the digital FFT spectrum analyzer in the early 1970 s. Today, impact testing (or bump testing) has become widespread as a fast and economical means of finding the modes of vibration of a machine or structure. In this paper, we review all of the main topics associated with EXPERIMENTAL MODAL ANALYSIS (or MODAL testing), in-cluding making FRF measurements with a FFT analyzer, MODAL excitation techniques, and MODAL parameter estima-tion from a set of FRFs (curve fitting). INTRODUCTION Modes are used as a simple and efficient means of character-izing resonant vibration.
2 The majority of structures can be made to resonate. That is, under the proper conditions, a structure can be made to vibrate with excessive, sustained, oscillatory motion. Resonant vibration is caused by an interaction between the inertial and elastic properties of the materials within a struc-ture. Resonant vibration is often the cause of, or at least a contributing factor to many of the vibration related problems that occur in structures and operating machinery. To better understand any structural vibration problem, the resonances of a structure need to be identified and quantified. A common way of doing this is to define the structure s mo-dal parameters. TWO TYPES OF VIBRATION All vibration is a combination of both forced and resonant vibration.
3 Forced vibration can be due to, Internally generated forces. Unbalances. External loads. Ambient excitation. Resonant vibration occurs when one or more of the reso-nances or natural modes of vibration of a machine or struc-ture is excited. Resonant vibration typically amplifies the vibration response far beyond the level deflection, stress, and strain caused by static loading. What are Modes? Modes (or resonances) are inherent properties of a structure. Resonances are determined by the material properties (mass, stiffness, and damping properties), and boundary conditions of the structure. Each mode is defined by a natural ( MODAL or resonant) frequency, MODAL damping, and a mode shape. If either the material properties or the boundary conditions of a structure change, its modes will change.
4 For instance, if mass is added to a vertical pump, it will vibrate differently because its modes have changed. At or near the natural frequency of a mode, the overall vibra-tion shape (operating deflection shape) of a machine or struc-ture will tend to be dominated by the mode shape of the re-sonance. What is an Operating Deflection Shape? An operating deflection shape (ODS) is defined as any forced motion of two or more points on a structure. Specify-ing the motion of two or more points defines a shape. Stated differently, a shape is the motion of one point relative to all others. Motion is a vector quantity, which means that it has both a location and a direction associated with it. Motion at a point in a direction is also called a Degree Of Freedom, or DOF.
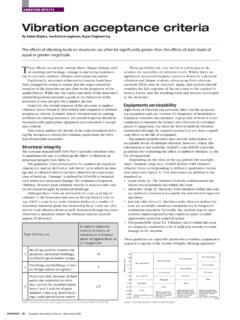
5 All EXPERIMENTAL MODAL parameters are obtained from measured ODS s. That is, EXPERIMENTAL MODAL parameters are obtained by arti-ficially exciting a machine or structure, measuring its operat-ing deflection shapes (motion at two or more DOFs), and post-processing the vibration data. Figure 1. Frequency Domain ODS From a Set of FRFs CSI Reliability Week, Orlando, FL October, 1999 Page 2 of 12 Figure 1 shows an ODS being displayed from a set of FRF measurements with the cursor located at a resonance peak. In this case, the ODS is being dominated by a mode and there-fore is a close approximation to the mode shape. Two Kinds of Modes Modes are further characterized as either rigid body or flexi-ble body modes. All structures can have up to six rigid body modes, three translational modes and three rotational modes.
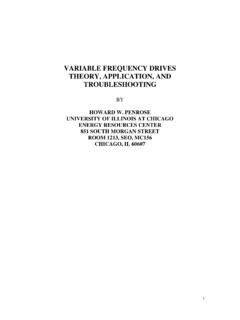
6 If the structure merely bounces on some soft springs, its mo-tion approximates a rigid body mode. Figure 2. Flexible Body Modes. Many vibration problems are caused, or at least amplified by the excitation of one or more flexible body modes. Figure 2 shows some of the common fundamental (low frequency) modes of a plate. The fundamental modes are given names like those shown in Figure 2. The higher frequency mode shapes are usually more complex in appearance, and there-fore don t have common names. FRF MEASUREMENTS The Frequency Response Function (FRF) is a fundamental measurement that isolates the inherent dynamic properties of a mechanical structure. EXPERIMENTAL MODAL parameters (fre-quency, damping, and mode shape) are also obtained from a set of FRF measurements.
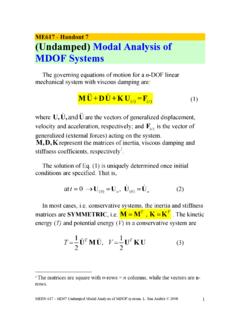
7 The FRF describes the input-output relationship between two points on a structure as a function of frequency, as shown in Figure 3. Since both force and motion are vector quantities, they have directions associated with them. Therefore, an FRF is actually defined between a single input DOF (point & direction), and a single output DOF. An FRF is a measure of how much displacement, velocity, or acceleration response a structure has at an output DOF, per unit of excitation force at an input DOF. Figure 3 also indicates that an FRF is defined as the ratio of the Fourier transform of an output response ( X( ) ) di-vided by the Fourier transform of the input force ( F( ) ) that caused the output. Figure 3. Block Diagram of an FRF. Depending on whether the response motion is measured as displacement, velocity, or acceleration, the FRF and its in-verse can have a variety of names, Compliance (displacement / force) Mobility (velocity / force) Inertance or Receptance (acceleration / force) Dynamic Stiffness (1 / Compliance) Impedance (1 / Mobility) Dynamic Mass (1 / Inertance) An FRF is a complex valued function of frequency that is displayed in various formats, as shown in Figure 4.
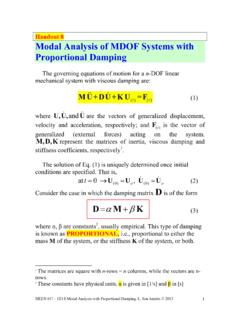
8 Figure 4. Alternate Formats of the FRF. VIBRATION IS EASIER TO UNDERSTAND IN TERMS OF MODES Figure 5 points out another reason why vibration is easier to understand in terms of modes of vibration. It is a plot of the Log Magnitude of an FRF measurement (the solid curve), but several resonance curves are also plotted as dotted lines be-CSI Reliability Week, Orlando, FL October, 1999 Page 3 of 12 low the FRF magnitude. Each of these resonance curves is the structural response due to a single mode of vibration. The overall structural response (the solid curve) is in fact, the summation of resonance curves. In other words, the overall response of a structure at any frequency is a summation of responses due to each of its modes. It is also evident that close to the frequency of one of the resonance peaks, the re-sponse of one mode will dominate the frequency response.
9 Figure 5. Response as Summation of MODAL Responses. WHY ARE MODES DANGEROUS? Figure 6 shows why modes cause structures to act as me-chanical amplifiers . At certain natural frequencies of the structure (its MODAL frequencies), a small amount of input force can cause a very large response. This is clearly evident from the narrow peaks in the FRF. (When a peak is very narrow and high in value, it is said to be a high Q reso-nance.) If the structure is excited at or near one of the peak frequen-cies, the response of the structure per unit of input force will be large. On the other hand, if the structure is excited at or near one of the anti-resonances (zeros or inverted peaks), the structural response will be very small per unit of input force.
10 Figure 6. FRF With High Q Resonance Peaks. TESTING REAL STRUCTURES Real continuous structures have an infinite number of DOFs, and an infinite number of modes. From a testing point of view, a real structure can be sampled spatially at as many DOFs as we like. There is no limit to the number of unique DOFs between which FRF measurements can be made. However, because of time and cost constraints, we only measure a small subset of the FRFs that could be measured on a structure. This is depicted in Figure 7. Yet, from this small subset of FRFs, we can accurately define the modes that are within the frequency range of the meas-urements. Of course, the more we spatially sample the sur-face of the structure by taking more measurements, the more definition we will give to its mode shapes.