Transcription of EXPLORING DATA AND STATISTICS Modeling with …
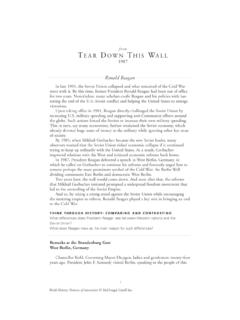
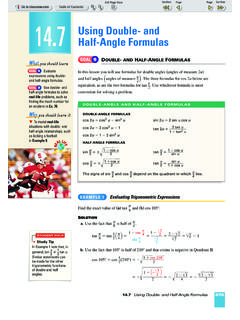
1 Page 1 of 2. E X P L O R I N G data . A N D S TAT I S T I C S Modeling with quadratic functions GOAL 1 WRITING quadratic functions . In Lesson you learned how to graph a given quadratic function. In this lesson you What you should learn will write quadratic functions when given information about their graphs. GOAL 1 Write quadratic functions given character- istics of their graphs. EXAMPLE 1 Writing a quadratic Function in Vertex Form GOAL 2 Use technology to find quadratic models for Write a quadratic function for the parabola shown. y data , such as the fuel econo- my data in Examples 3 and 4.
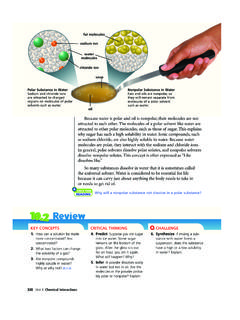
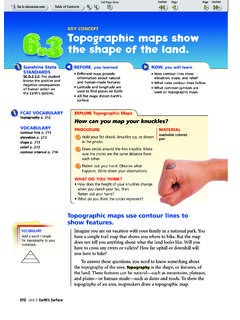
2 SOLUTION 1 (4, 1). Because you are given the vertex (h, k) = (2, 3), 1 x Why you should learn it use the vertex form of the quadratic function. To solve real-life y = a(x h)2 + k vertex: (2, 3). problems, such as deter- y = a(x 2)2 3. mining the effect of wind on a runner's performance Use the other given point, (4, 1), to find a. in Ex. 36. AL LI 1 = a(4 2)2 3 Substitute 4 for x and 1 for y. FE. RE. 1 = 4a 3 Simplify coefficient of a. 4 = 4a Add 3 to each side. 1=a Divide each side by 4. A quadratic function for the parabola is y = (x 2)2 3. EXAMPLE 2 Writing a quadratic Function in Intercept Form Write a quadratic function for the parabola shown.
3 Y SOLUTION ( 1, 2). 1. Because you are given the x-intercepts p = 2 and q = 3, use the intercept form of the quadratic function. 2 1 3 x y = a(x p)(x q). y = a(x + 2)(x 3). Use the other given point, ( 1, 2), to find a. 2 = a( 1 + 2)( 1 3) Substitute 1 for x and 2 for y. 2 = 4a Simplify coefficient of a. 1. = a Divide each side by 4. 2. 1. A quadratic function for the parabola is y = (x + 2)(x 3). 2. 306 Chapter 5 quadratic functions Page 1 of 2. ACTIVITY. Developing Concepts Writing a quadratic in Standard Form In this activity you will write a quadratic function in standard form, y = ax 2 + bx + c, for the parabola in Example 2.
4 1 The parabola passes through ( 2, 0), ( 1, 2), and (3, 0). Substitute the coordinates of each point into y = ax 2 + bx + c to obtain three equations in a, b, and c. For instance, the equation for ( 2, 0) is: 0 = a( 2)2 + b( 2) + c, or 0 = 4a 2b + c 2 Solve the system from Step 1 to find a, b, and c. Use these values to write a quadratic function in standard form for the parabola. 3 As a check of your work, use multiplication to write the function 1. y = (x + 2)(x 3) from Example 2 in standard form. Your answer 2. should match the function you wrote in Step 2.
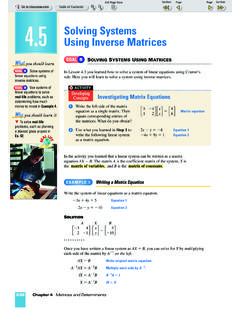
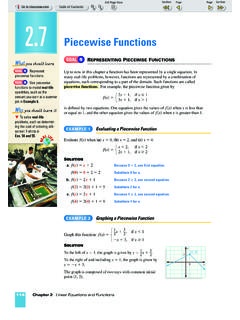
5 L. AL I EXAMPLE 3 Finding a quadratic Model for a data Set FE. RE. Fuel Economy A study compared the speed x (in miles per hour) and the average fuel economy y (in miles per gallon) for cars. The results are shown in the table. Find a quadratic model in standard form for the data . Source: Transportation Energy data Book Speed, x 15 20 25 30 35 40. Fuel economy, y Speed, x 45 50 55 60 65 70. Fuel economy, y SOLUTION. Plot the data pairs (x, y) in a coordinate plane. y Draw the parabola you think best fits the data . (40, 30). 30. Fuel economy (mi/gal). Estimate the coordinates of three points on the (60, 28).
6 Parabola, such as (20, 25), (40, 30), and (60, 28). 28. Substitute the coordinates of the points into the 26. 2. model y = ax + bx + c to obtain a system of (20, 25). 24. three linear equations. 22. 400a + 20b + c = 25. 0. STUDENT HELP 1600a + 40b + c = 30 0 20 40 60 80 x Speed (mi/h). Look Back 3600a + 60b + c = 28. For help with solving systems of three linear Solve the linear system. The solution is a = , b = , and c = 13. equations, see pp. 177, 217, and 231. A quadratic model for the data is y = 2 + + 13. Modeling with quadratic functions 307. Page 1 of 2.
7 FOCUS ON. CAREERS. GOAL 2 USING TECHNOLOGY TO FIND quadratic MODELS. In Chapter 2 you used a graphing calculator to perform linear regression on a data set in order to find a linear model for the data . A graphing calculator can also be used to perform quadratic regression. quadratic regression produces a more accurate quadratic model than the procedure in Example 3 because it uses all the data points. The model given by quadratic regression is called the best-fitting quadratic model. EXAMPLE 4 Using quadratic Regression to Find a Model FUEL ECONOMY Use the fuel economy data given in Example 3 to complete L.
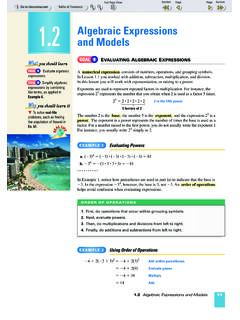
8 AL I parts (a) and (b). AUTOMOTIVE. FE. RE. DESIGNER. a. Use a graphing calculator to find the best-fitting quadratic model for the data . Automotive designers help conceive of and develop b. Find the speed that maximizes a car's fuel economy. new cars. They have to consider such factors SOLUTION. as a car's appearance, performance, and fuel a. Enter the data into two lists of Make a scatter plot of the data . Note economy (the focus of a graphing calculator. that the points show a parabolic trend. Example 4). NE. ER T. INT. CAREER LINK L1 L2 L3. 15 20 25 30 29.
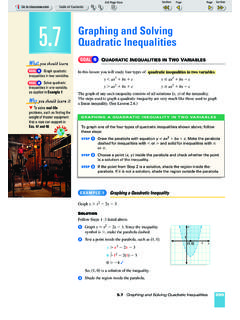
9 35 L2(5)= Use the quadratic regression Check how well the model fits the feature to find the best-fitting data by graphing the model and the quadratic model for the data . data in the same viewing window. QuadReg y=ax2+bx+c a= b=.7458891109. c= The best-fitting quadratic model is y = 2 + + STUDENT HELP b. You can find the speed that maximizes fuel NE. ER T. economy by using the Maximum feature of KEYSTROKE HELP. INT. a graphing calculator, as shown at the right. Visit our Web site You can also find the speed algebraically using to see keystrokes for the formula for the x-coordinate of a parabola's Maximum several models of X= Y= vertex from Lesson : calculators.
10 B x = = 45. 2a 2( ). The speed that maximizes a car's fuel economy is about 45 miles per hour. 308 Chapter 5 quadratic functions Page 1 of 2. GUIDED PRACTICE. Vocabulary Check 1. Complete this statement: When you perform quadratic regression on a set of data , the quadratic model you obtain is called the . ?. Concept Check 2. How many points are needed to determine a parabola if one of the points is the vertex? if none of the points is the vertex? Skill Check Write a quadratic function in the specified form for the parabola shown. 3. vertex form 4. intercept form 5.