Transcription of KEY CONCEPT Topographic maps show the shape …
1 Sunshine : The studentknows the positive andnegative consequencesof human action onthe Earth s 2:Earth s SurfaceBEFORE, you learned Different maps provide information about natural and human-made features Latitude and longitude areused to find places on Earth All flat maps distort Earth s surfaceNOW, you will learn How contour lines showelevation, slope, and relief What rules contour lines follow What common symbols areused on Topographic mapsKEY CONCEPTT opographic maps showthe shape of the a word triangle for topography to maps use contour lines to show you are on vacation with your family in a national park. Youhave a simple trail map that shows you where to hike.
2 But the mapdoes not tell you anything about what the land looks like. Will youhave to cross any rivers or valleys? How far uphill or downhill will you have to hike?To answer these questions, you need to know something about the topography of the the shape , or features, ofthe land. These features can be natural such as mountains, plateaus,and plains or human-made such as dams and roads. To show thetopography ofan area, mapmakers draw a Topographic Topographic MapsHow can you map your knuckles?PROCEDUREHold your fist closed, knuckles up, as shown in the circles around the first knuckle. Make sure the circles are the same distance from each out your hand.
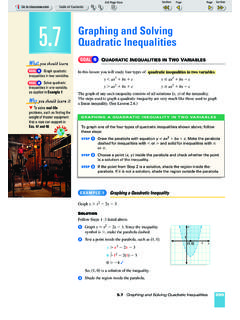
3 Observe what happens. Write down your DO YOU THINK? How does the height of your knuckles changewhen you clench your fist, then flatten out your hand? What do you think the circles represent?321 MATERIAL washable coloredpenFCAT VOCABULARY topographyp. 212 VOCABULARY contour linep. 213elevationp. 213slopep. 213reliefp. 213contour interval p. 214 Chapter 6:Views of Earth Today213A Topographic map is a flat map that uses lines to show Earth ssurface features. Distance and elevation can be given in feet or a look at the Topographic map of Mount Hood on this page. Thewiggly lines on the map are called and they show anarea s elevation, slope, and of a place is how high abovesea level it is.
4 An area can range from a fewmeters to several thousand meters abovesea level. The numbers on the contourlines show the elevations of differentpoints in the Mount Hood of a landform or area is howsteep it is. The more gradual the slope, thefarther apart the contour lines on the steeper the slope, the closer togetherthe contour of an area is the difference between its high and lowpoints. For example, subtracting the lowest elevation on the mapfrom the highest gives you a measure of the area s your readingWhat is the difference between elevation and slope?relief3slope2elevation1contour lines,A Topographic map shows the land as if you were above the landlooking down on it.
5 Mount Hood Topographic MapWhat is the elevation of the top of Mount Hood?Contour lines show themountain s peak as seen fromabove. The elevationhereis given in different elevationson a map indicate anarea s lines close togethershow a steep slope. Linesfarther apart show a moregentle lines follow certain lines on Topographic maps can help you visualize landforms. Think of the following statements as rules for reading such maps: Lines never lines never cross, because each linerepresents an exact elevation. Circles show highest and lowest lines formclosed circles around mountaintops, hilltops, and the centers ofdepressions, which are sunken areas in the ground.
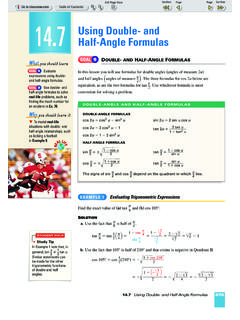
6 Sometimes,the elevation of a mountain or hill is written in meters or feet in the middle of the circle. Contour interval is always the same on a map. The is the difference in elevation from one contour line tothe next. For example, the contour interval on the map below is10 feet. This means that the change in elevation between contourlines is always 10 feet. The contour interval can differ from mapto map, but it is always the same on a particular IDEA AND DETAILSUse your main idea anddetails chart to take noteson the rules for reading atopographic 2:Earth s SurfaceEly, Minnesota, Topographic MapStudy the hill with the number 29 on it.
7 Use the contour interval andindex contour lines to calculate the highest point of this contour intervalon this map is 10 circlesindicate the tops ofland features. Onecircle includes theelevation (1427 feet).These index contourlinesmark an elevationof 1400 feet. Notice thatindex lines are darker thanthe other contour the relationshipbetween topographicmaps and surface 6:Views of Earth Today215 Index contour lines mark darker contour lineson a map are called index contour lines. Numbers that indicateelevations are often written on these lines. To calculate higher orlower elevations, simply count the number of lines above orbelow an index line.
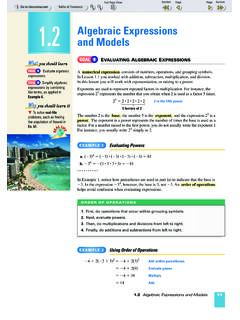
8 Then multiply that number by the contourinterval. For instance, on the Ely map, one index line marks 1400feet. To find the elevation of a point three lines up from thisindex line, you would multiply 10 feet (the contour interval) by3. Add the result, 30, to 1400. The point s elevation is 1430 your readingWhat information do index contour lines provide?Besides contour lines, Topographic maps also contain symbols for natural and human-made features. Below are some common mapsymbols that the United States Geological Survey (USGS) uses on itstopographic USGS provides Topographic maps for nearly every part of theUnited States. These maps cover urban, rural, and wilderness and campers are not the only ones who use Topographic , archaeologists, forest rangers, biologists, and others rely onthem as do contour lines showelevation, slope, and relief?
9 Do contour lines nevercross on a Topographic map? would you show the topof a hill, an area of vegetation,or a hiking trail on a topo-graphic map?CRITICAL THINKING4. ApplyFor an area with gentlysloping hills and little relief,would you draw contour linesclose together or far apart?Explain Compare and ContrastHow would a road map and atopographic map of the samearea differ? What informationwould each provide?CHALLENGE6. SynthesizeWork with agroup to make a topographicmap of the area around yourschool. First decide how big an area you will include. Thenchoose a contour interval, amap scale, and symbols forbuildings, sports fields, andother features.
10 Let other stu-dents test the map s Map SymbolsMarsh or swampVegetationLake or pondHiking trailStreamRailroad tracks