Transcription of FACT SHEET - NCCP | Home
1 fact SHEET Mercedes Ekono | Yang Jiang | Sheila Smith January 2016 Young Children in Deep Poverty Copyright 2015 by the National Center for Children in PovertyThe National Center for Children in Poverty (NCCP) is a non-partisan public policy research center at Columbia University s Mailman School of Public Health. Founded in 1989 with endowments from the Carnegie Corporation of New York and the Ford Foundation, NCCP is dedicated to promoting the economic security, healthy development, and well-being of America s low-income children and families. Using research to inform policy and practice, the center seeks to advance family-oriented solutions and the strategic use of public resources at the state and national levels to produce positive outcomes for the next CHILDREN IN DEEP POVERTYABOUT THE AUTHORSM ercedes Ekono is Data Analyst; Yang Jiang is Senior Research Associate; and Sheila Smith is Director, Early Childhood at publication was made possible by the generous support of The Alliance for Early Success.
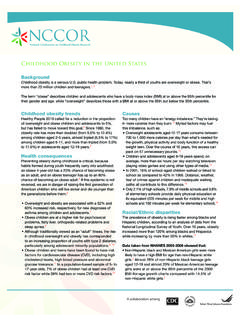
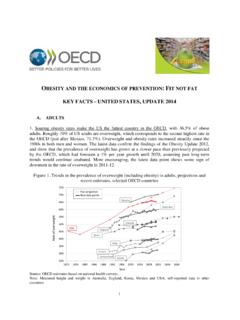
2 The authors thank Ren e Wilson-Simmons, Curtis Skinner, and Yumiko Aratani for reading and commenting on the draft, and Diana Gazzia for design and CITATIONE kono, M., Yang, J., & Smith, S. (2016). Young Children in Deep Poverty. New York: National Center for Children in Poverty, Mailman School of Public Health, Columbia Children in Deep Poverty 3 IntroductionA family of three living in deep poverty survives on an annual income below $9,276, or less than $ a day per family member. The struggle to raise children on such a meager income is not a rare circumstance among families, especially those with young children. Currently, 11 percent of young children (0-9 years) live in households with incomes below 50 percent of the federal poverty line (FPL), up from 9 percent in The percentage of young chil-dren in deep poverty varies across the states, from 5 percent in North Dakota to 18 percent in Mississippi, 16 percent in South Carolina, and 14 percent in Kentucky and West (See Appendix A.)
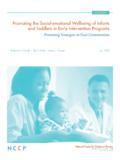
3 While the negative effects of poverty on children s early development and long-term school and health outcomes are well documented,3, 4 less is known about the well-being and family circumstances of young children in the subgroup of families with the scarcest financial resources, especially relative to other income groups. This fact SHEET compares the early health, development, and risk characteristics of young chil-dren in deep poverty to children in families that are poor, but not deeply poor, and to families that are not poor. These groups, defined by family income, are: u Young children in deep poverty (family income is below 50 percent of the FPL) u Young children who are poor, but not in deep poverty (family income is 50 percent of the FPL to 99 percent of the FPL) u Young children who are not poor (family income is 100 percent or more of the FPL)Figure 1: Children under age 9 in families experiencing economic hardshipPoor50-99% FPL13%Deeply poorLess than 50% FPL11%Above poor100% or more FPL76%Source.
4 NCCP analysis of data from the American Community Survey (ACS) Children in Deep PovertyMercedes Ekono | Yang Jiang | Sheila Smith January 20164 National Center for Children in PovertyThis fact SHEET provides the following information about young children and families in these Prevalence of children experiencing selected health and developmental conditionsu Prevalence of children whose parents have charac-teristics that pose risks for developmentu Prevalence of children whose neighborhoods present challenges to parenting and developmentThe second section of the fact SHEET focuses on young children in deep poverty with and without additional family risk factors. The prevalence of young children with negative mental health and development indica-tors is compared across deeply poor children whose parents experience fair to poor parent health and other adversities, and children in families without these difficulties.
5 Results reported in this section suggest that even within a vulnerable group young children in deep poverty certain family adversities may increase children s risk of poor mental health and development. MethodsThis fact SHEET used 2011 2013 data from four nationally representative data sets: the American Community Survey (ACS), the National Health and Nutrition Examination Survey (NHANES), the National Health Interview Survey (NHIS), and the National Survey of Children s Health (NSCH). The ACS data set was used to identify family, neighborhood, and demographic characteristics of children at different income levels, while NHANES, NHIS, and NSCH data sets were used to identify the child health, social-emotional/mental health, and developmental status of children at different income levels.
6 The analyses focused on children under age 9. However, age ranges vary for different health and development measures according to their use in surveys and appropri-ateness for specific ages. In most cases, the data collected in the surveys were based on parent report; exceptions are obesity and lead blood levels, which were directly measured. The first set of analyses showed the percent-ages, across the three income groups, of children with selected child or family characteristics ( , child health, parent education). The cases were weighted to ensure their representativeness in the national population. The second set of analyses focused on young children in deep poverty exclusively and examined the percentage of children with negative mental health and development indicators across groups in which parents reported the presence or absence of risk factors such as poor or fair parent health or parenting stress.
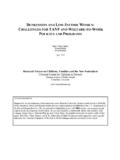
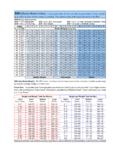
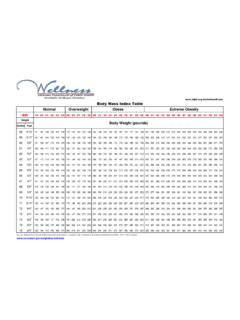
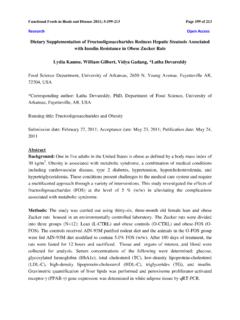
7 Figure 2: state variation in children under age 9 living in deep povertyDCPercent of children in deep poverty5 7% 8 10% 11 13% 14% and aboveSource: NCCP analysis of data from the American Community Survey (ACS) Children in Deep Poverty 5I. Comparing children across three groups: Deep poverty, Poverty, Non-Poor Elevated blood lead levels in children are associated with serious behavior and learning problems and lower academic , 8, 9, 10, 11 The percentage of young children in deep poverty who have elevated lead levels is three times higher than the percentage for poor children, and over 17 times higher than the percentage for non-poor children. Child Mental Health and Development StatusThe prevalence of diagnosed depression and anxiety in children, as reported by parents, appears similar among deeply poor, poor, and non-poor 2-9 year olds (in the range of 1 to 2 percent for depression and 2 to 3 percent for anxiety).
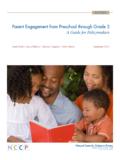
8 Deeply poor and poor 6-9 year olds show about double the prevalence of parent-reported child stress as non-poor Health StatusChildhood obesity is associated with both psycho-logical problems in childhood and adolescence and poor health , 6 Nearly twice as many young children in deep poverty are obese compared to non-poor children age 2-9 years. The percentage of children who are obese among young children in deep poverty is higher than the percentage of children who are obese among young, poor children. Eighteen percent of deeply poor, 15 percent of poor, and 10 percent of above poor 2-9 year olds are obese. Figure 4: Lead levels in the blood of children age 1-9 Above poorPoorDeeply : NCCP analysis of data from the National Health and Nutrition Examination Survey (NHANES) 3: Child obesity by poverty status for children age 2-9 Above poorPoorDeeply poor10%15%18%Source: NCCP analysis of data from the National Health and Nutrition Examination Survey (NHANES) 5: Child mental health by poverty status for children age 2-9*Above poorPoorDeeply poorStressAnxietyDepression9%3%2%4%2%1%8 %3%2%Source: NCCP analysis of data from the National Survey of Children s Health (NSCH) 2011-2012.
9 *Child stress is among children 6-9 years; Source: NCCP analysis of data from the National Health Interview Survey (NHIS) 2012 6 National Center for Children in PovertyThe prevalence of a diagnosed developmental delay in children, as reported by parents, is similar among deeply poor, poor, and non-poor 2-9 year olds; the prevalence is 7 percent among deeply poor and poor children and 6 percent for non-poor children. However, about twice as many deeply poor and poor parents reported that their children are at-risk for developmental delays as parents of non-poor children (20 percent for deeply poor, 18 percent for poor, and 9 percent for non-poor children). Parents report of risk for developmental delay is based on a set of ques-tions asking about the parent s concern regarding different aspects of the child s learning and behavior (see Appendix B).
10 The prevalence of children age 6 months to 5 years, viewed by parents as flourishing, is under 50 percent for deeply poor children; this percentage rises to 62 percent for poor children, and rises further to 72 percent for non-poor children. (The child s score for flourishing reflects the parent s perception of the child as affectionate, curious, laughing, and able to bounce back after a disappointment.) The prevalence of children age 6 to 9 years, viewed by parents as flourishing, was similarly low for deeply poor (37 percent) and poor children (36 percent) compared to non-poor children (51 percent).Parent Characteristics that May Pose Risks for Children Less than one-third of children in deep poverty live in households headed by a married parent (29 percent).