Transcription of Financial development and inclusion in Kenya - World Bank
1 Financial development and inclusion in Kenya July 2012, Robert Cull (DECFP) In a previous feature ( ), we highlighted the impact of M-PESA, a mobile phone-based system for person-to-person payments and money transfers that, since its inception in 2007, has attracted over ten million customers, more than half of Kenya s adult population. Less emphasis, however, has been given to the dramatic expansion of the Kenyan network of bank branches that took place over the same period. From 2006 to 2009, the number of bank branches increased by nearly 70%, from 576 to 970, and all types of banks (government-owned, foreign-owned, and private domestically owned) took part in the expansion. Because banks offer a wider set of Financial services than the payments services offered through M-PESA (previous research has shown few M-PESA customers use their accounts to save, for example), this branch expansion could potentially produce more substantial benefits to households associated with a deeper Financial inclusion .
2 To better understand the difficulties in fostering Financial inclusion in Africa, Franklin Allen, Elena Carletti, Jun QJ Qian, Lemma Senbet, Patricio Valenzuela, and I first performed a cross-country analysis comparing the determinants of Financial development in Africa with those in the rest of the developing World ( ). One of our main findings was that population density explained greater variation in banking sector development (as measured by both liquid liabilities and private credit relative to GDP) in Africa than in other developing countries. If frequent interactions among firms, households, and investors are a necessary condition for business transactions and therefore Financial development , then our results are plausible in that many African countries are endowed with scattered populations and have sparse road networks.
3 The cross-country analysis also revealed that traditional factors that have been associated with Financial sector development in other developing countries, such as low inflation, high GDP growth, and broad measures of institutional quality explain little variation within Africa. Nor do we find that Africa s Financial development gap is attributable to a natural resource curse. Proxies for abundance of natural resources explain roughly the same amount of Financial sector development Africa as in other developing regions. When we use the determinants of Financial sector development outside of Africa to predict what Financial development levels should have been within Africa, we see that most African countries fall far short of predicted values (Figure 1).
4 If a country exceeds its level of Financial development as predicted by our regression for the developing World (outside of Africa) it should lie above the 45 degree line in Figure 1. There are only two countries, namely Cape Verde and Mauritius (CPV and MUS in Figure 1) among the smallest in Africa that exceed their predicted levels by a substantial amount, but neither of the two is particularly reflective of the African experience. The ten poorest performers range from 22 to 34 percentage points below their predicted levels, and the average country falls short of its predicted level by 12 points. The magnitude of this measure of under-performance is quite large when one considers that the average ratio of private credit to GDP within Sub-Saharan Africa stood at in 2005.
5 Actual private credit ratios in Africa are only slightly better than half their predicted levels. More recently, data from the Global Financial inclusion Index (the Global Findex), a survey of users of Financial services across 148 countries that was conducted by the World Bank Research Group with Financial support from the Bill and Melinda Gates Foundation, also indicates that Africa lags far behind other developing regions. Whereas 39% of survey respondents from Latin America and the Caribbean have an account with a Financial institution, only 23% of African respondents do. In Eastern Europe and Central Asia 45% of respondents have an account; for East Asia and the Pacific the share is 55%; and for high income countries, the figure is 89%.1 As part of a National Bureau of Economic Research program to study African Economic Successes (read more here: ), we chose to examine banking development in Kenya (click here for the full study: ).
6 Based on our cross-country analysis, Kenya s level of Financial development is not too far below its predicted level (KEN in Figure 1). In fact, among large African countries with predicted ratios of private credit to GDP greater than 25%, Kenya is the only one to come close to its predicted level of Financial sector development . And as noted above, it has witnessed a strong expansion in bank branches in recent years. This expansion has also coincided with the emergence of Equity Bank, a pioneering (for-profit) commercial bank that devised a banking service strategy targeting low income clients and traditionally under-served territories. The bank is listed on the Nairobi Stock Exchange, and has no government ownership share. 1 See Asli Demirguc-Kunt and Leora Klapper, 2012.
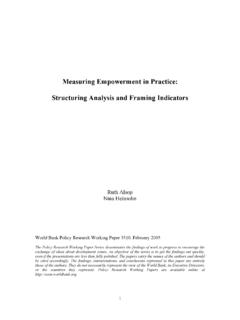
7 Financial inclusion in Africa: An Overview. World Bank Policy Research working paper 6088. As part of its expansion strategy, Equity Bank emphasized that local languages be spoken in its branches, an important consideration since 30-40 percent of the people in central Kenya cannot speak Swahili and only speak a minority language. As shown in Figure 2, in districts where minority languages ( , languages other than English and Swahili) are spoken more frequently, all types of banks appear to have increased their branching, though the largest increase in branches is for private domestically owned banks. Most of the increase in branches among the private domestic banks in those areas is attributable to Equity Bank, and only Equity entered these districts while at the same time developing a business strategy designed specifically to make minority language speakers more comfortable.
8 Figure 2. Bank Penetration in Kenya . This Figure shows the number of bank branches according to different ownership structures: Foreign banks, Government banks, and Domestic private banks. In low minority language districts the share of the population speaking a minority language is smaller than the median across all districts. Regressions confirm that Equity Bank was more likely than other banks to open new branches in non-urban, non-English or Swahili-speaking, and sparsely populated districts. To assess the impact of Equity s strategy on Financial inclusion , we constructed a district-level panel data set of the number of branches by bank. We then merged the branching data set with nationally representative household surveys of Financial usage conducted by the Financial Sector Deepening Trust Kenya (FSD Kenya ) in 2006 and 2009.
9 We exploit the fact that Equity s branching policy favored minority-speaking districts more than those of other banks, and we use instrumental variables (IV) regressions to identify the impact of Equity Bank s branch penetration on households access to banking services. Our instruments are based on the fraction of minority language speakers in a district. We also control for the language of the survey respondent in our regressions, which itself could be a determinant of account usage. But we argue that the fraction of people from a district speaking a particular language should not be directly linked to whether a particular individual or household has access to a bank account, which is our outcome 2 We note that our instruments are valid in that they pass Hansen s J test of over-identifying restrictions in all of our regressions.
10 050100150200250300 Foreign banksLocal private banksHigh Minority Language Districts20062009We find that the presence of Equity Bank branches has a positive and significant impact on households use of bank accounts and bank credit. Similar results hold for simple probit regressions that compare the effects of Equity s branching with that of other banks on changes in account usage, and when we use a difference-in-difference estimator that s compares changes in account usage in districts where Equity Bank started operations between 2006 and 2009 relative to districts that had no Equity bank branch during the same period. All of these estimation techniques yield similar results. Equity s presence is associated with a 4 to 9 percentage point increase in the probability of having a bank account.