Transcription of FISCAL IMPACT ANALYSIS - Anchorage, Alaska
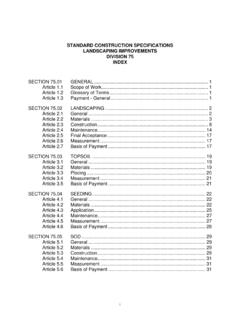
1 FISCAL IMPACT ANALYSIS PROTOTYPE LAND USE FISCAL IMPACT ANALYSIS Prepared for anchorage 2020 anchorage Bowl Comprehensive Plan Municipality of anchorage , Alaska June 30, 2000 Prepared by: Tischler & Associates, Inc. Bethesda, Maryland Pasadena, California Prototype Land Use FISCAL IMPACT ANALYSIS Municipality of anchorage , Alaska TABLE OF CONTENTS I. EXECUTIVE SUMMARY ..1 A. B. FISCAL IMPACT RESULTS-COMBINED 1. Residential 2. Nonresidential Prototypes ..3 C. II. BACKGROUND ..6 III. LAND USE A. RESIDENTIAL B. NONRESIDENTIAL IV.
2 GENERAL METHODOLOGY ..9 A. ANNUAL COSTS AND 1. Per Capita ..9 2. Per Capita and 3. Per Trip ..9 4. Per Housing 5. Non-Factor Based Calculations ..10 6. Annualized One-Time Operating Revenues and 7. Annualized Direct Operating 8. Annualized Marginal Operating 9. Annualized Capital Costs ..11 V. FISCAL IMPACT RESULTS-GENERAL FUND ..13 A. ANNUAL NET 1. Residential 2. Nonresidential Prototypes ..14 B. ANNUAL C. ONE-TIME D. ANNUAL OPERATING E. ONE-TIME OPERATING F. ANNUALIZED CAPITAL VI. FISCAL IMPACT RESULTS-SCHOOL DISTRICT ..18 A. ANNUAL NET RESULTS-SCHOOL B.
3 ANNUAL C. ANNUAL OPERATING D. ANNUALIZED CAPITAL Prototype Land Use FISCAL IMPACT ANALYSIS Municipality of anchorage , Alaska This page intentionally left blank. Prototype Land Use FISCAL IMPACT ANALYSIS Municipality of anchorage , Alaska 21. Residential Prototypes Combined Annual Net Results - Residential Prototypes (per unit)Municipality of anchorage Prototype ANALYSIS $579($513)($1,199)$153($384)($2, 004)($620)($360)($770)($386)($158)($1,84 6)($2,500)($2,000)($1,500)($1,000)($500)
4 $0$500$1,000SF-Urb/SubSF- FundSchool DistrictCombined The chart above indicates that all four residential prototypes generate combined net deficits to the General Fund and School District, although the single family-rural generates net revenues to the General Fund and the townhouse/condominium prototype generates net revenues to the School District. The following points summarize the combined residential General Fund and School District findings in order from best to worst: The townhouse/condominium prototype generates the best combined result, net deficits of $360 per unit.
5 While net deficits of $513 per unit are generated to the General Fund, modest net revenues of $153 per unit are generated to the School District because of the relatively low School District cost resulting from a smaller pupil yield factor. The single family-rural prototype generates a combined net deficit of $620 per unit. Although this prototype generates the second largest net deficit to the School District, net revenues of $579 per unit are generated for the General Fund as a result of this prototype s high market value. The apartment prototype generates a combined net deficit of $770 per unit.
6 Because of the same pupil yield factor, this prototype generates the same School District costs as the townhouse/condominium prototype, but generates less in revenues because of a lower market value. The single family-urban/suburban prototype generates the largest combined net deficit ($2,004 per unit). This prototype generates the second best General Fund result, net deficits Prototype Land Use FISCAL IMPACT ANALYSIS Municipality of anchorage , Alaska 3of $158 per unit, but the poorest School District result.
7 Although it generates the same School District costs as the single family-rural, less revenue is generated because of a lower market value. 2. Nonresidential Prototypes Combined Annual Net Results - Nonres. Prototypes (per 1,000 sq. ft.)Municipality of anchorage Prototype ANALYSIS ($1,208)($246)($1,619)$481$28$62 3$935$467$662$351($585)$689($1,152)$1,14 3$379($2,000)($1,500)($1,000)($500)$0$50 0$1,000$1, FundSchool DistrictCombined As the table above indicates, three of the five nonresidential prototypes generate combined net revenues to the General Fund and School District.
8 The following points summarize the combined nonresidential General Fund and School District findings: Two of the five nonresidential prototypes generate net revenues to the General Fund, whereas all nonresidential prototypes generate net revenues to the School District, as there are no direct costs associated with nonresidential uses. The hotel prototype generates the best combined result, net revenues of $1,143 per 1,000 square feet. This is due primarily to having the lowest General Fund costs as a result of the lowest employment density.
9 In addition, this prototype has the second highest market value per 1,000 square feet. The office prototype generates the highest revenue due to its higher market value. Although costs for this prototype are relatively low, they are not as low as the hotel prototype. As a result, the office prototype generates the second highest net revenues, $689 per 1,000 square feet. Prototype Land Use FISCAL IMPACT ANALYSIS Municipality of anchorage , Alaska 4 The industrial prototype also generates combined net revenues, $379 per 1,000 square feet.
10 Although this prototype has the second lowest costs, it generates the lowest revenue due to having the lowest market value. Although the retail prototype generates the second highest revenues, it generates the second highest costs. Net deficits of $585 per 1,000 square feet are the result. The service prototype generates the poorest combined result, net deficits of $1,152 per 1,000 square feet, primarily because this prototype generates the greatest costs and the second lowest revenues. C. Conclusions The following major points can be concluded from the ANALYSIS .