Transcription of Flood Frequency Analysis Using the Gumbel Distribution
1 Never Mujere / International Journal on Computer Science and Engineering (IJCSE). Flood Frequency Analysis Using the Gumbel Distribution Never Mujere University of Zimbabwe, Department of Geography and Environmental Science, Box MP 167, Mount Pleasant, Harare E-mail Abstract This paper presents results of a study carried in Zimbabwe aimed at analysing the Frequency of Nyanyadzi River floods Using the Gumbel Distribution . Extreme floods over recent years had washed away fields, destroyed infrastructure and killed animals. It was hypothesised that Nyanyadzi Flood flows obey the Gumbel Distribution . The scale and shape parameters of the Distribution were estimated Using method of moments. Maximum instantaneous flow data covering 30 water years (1969-1999) for station E119 on Nyanyadzi River were collected from the Zimbabwe National Water Authority (ZINWA). A Chi- square 2 test revealed no significant (p = ) differences between recorded and predicted Flood flows.
2 Due to goodness of fit of the Gumbel Distribution , it was assumed to be appropriate for modelling Frequency of Nyanyadzi River floods. The magnitudes of the 100 and 200-year floods were estimated to be 276 and 310 m3/s respectively. Key words. Flood , Frequency ; Gumbel Distribution ; Nyanyadzi; return period Introduction Nyanyadzi River catchment is one of regions in Zimbabwe where floods are causing enormous negative impacts to both property and life. Over recent years, floods have killed animals, drowned cropland, destroyed infrastructure and left people homeless. Outbreak of water-borne diseases, such as malaria and cholera is also common during Flood periods (Chenje et al., 1998; AGRITEX, 2000). Almost every year, a lot of resources are invested for Flood mitigation and protection Using either structural (achieved by river training, storage dams and weirs) and/or non-structural (achieved by means of Flood forecasting and rescue operations) measures.
3 However, meteorological forecasts can only provide very short forecasts in an accurate form, which may not allow enough time to reduce the impact of Flood events. In addition, due to previous false alarms, people no longer take forecasts seriously (Madamombe, 2005). Given the above shortcomings of Flood forecasting Using rainfall data, this paper attempts to estimate return periods associated with Flood peaks of different magnitudes from recorded historical floods Using statistical method. The selected method is Gumbel extreme value Distribution which is widely used for Flood Frequency Analysis . ISSN : 0975-3397 Vol. 3 No. 7 July 2011 2774. Never Mujere / International Journal on Computer Science and Engineering (IJCSE). Flood Frequency Analysis Flood Frequency Analysis involves the fitting of a probability model to the sample of annual Flood peaks recorded over a period of observation, for a catchment of a given region. The model parameters established can then be used to predict the extreme events of large recurrence interval (Pegram and Parak, 2004) Reliable Flood Frequency estimates are vital for floodplain management; to protect the public, minimize Flood related costs to government and private enterprises, for designing and locating hydraulic structures and assessing hazards related to the development of Flood plains (Tumbare, 2000).
4 Nevertheless, to determine Flood flows at different recurrence intervals for a site or group of sites is a common challenge in hydrology. Although studies have employed several statistical distributions to quantify the likelihood and intensity of floods, none had gained worldwide acceptance and is specific to any country (Law and Tasker, 2003). Previous studies in Zimbabwe have estimated Flood magnitude from catchment area, rainfall, shape slope and length. It was observed that more than 90% (R2= ) of the variations in Flood magnitude could be explained by catchment area (Mitchell, 1974; Wurzel, 1986). However, rivers in the eastern highlands of the country were not incorporated in the study because they showed unique behaviour. This study therefore applies the Gumbel statistical Distribution for Flood Frequency Analysis . To the best of the author's knowledge, no previous studies in the area have attempted to model Flood discharges Using the Gumbel Distribution , a stochastic generating structure that produce random outcomes.
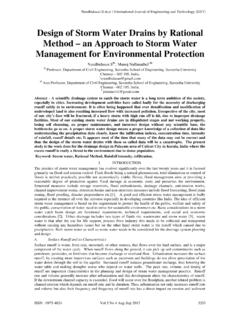
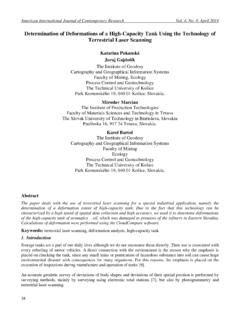
5 It was thus, hypothesized that Nyanyadzi River Flood flows fit Gumbel Distribution model. Materials and methods Study area Nyanyadzi River flows from its source in the humid eastern highlands (1 500 m), of Chimanimani district westward into the dry Odzi River valley having an altitude of 400 m (Figure 1). Fig. 1. Location of Nyanyadzi River system. Nyanyadzi River and its tributaries drain a catchment area of 800 km2 covering all the 4 agro-ecological regions of the country. The river flows through large-scale commercial farmlands, resettlement and communal areas, from a high rainfall area (1200 mm annually) into the dry, sparsely vegetated lowveld (400 mm annually). It exhibits a simple flow regime (Mujere, 2006). Low flows occur during the dry months, from April to November while high flows are experienced during the rain season, from December to March. River floods commonly occur in January or February. They are dependent on the inter-tropical convergence low-pressure system and tropical cyclones from the Indian Ocean (Tumbare, 2000; AGRITEX, 2000).
6 ISSN : 0975-3397 Vol. 3 No. 7 July 2011 2775. Never Mujere / International Journal on Computer Science and Engineering (IJCSE). Data collection and Analysis Daily maximum instantaneous flow data (in m3/s) covering 30 water years of record for E119 gauging station on Nyanyadzi River were obtained from the Zimbabwe National Water Authority (ZINWA). A water year in Zimbabwe begins on October1st and ends on September 30th of the designated year. The flow recording station, which was washed away by floods on 22 February 2000, was equipped with an automatic recorder. Flow data were expressed in terms of exceedance probabilities and recurrence intervals. Denoting Qi as the annual maximum Flood in year i, the quantile Qi (F) is the value expected Qi to exceed with probability F, that is, P(Qi Qi (F)) = F during the year of interest. Thus, there is a F% chance that Q Q(F). Conversely, there is a (1 F)% chance that X < Q(F). The return period of a Flood , 1/(F) is the reciprocal of the probability of exceedance in one year (Haan, 1977; Shaw, 1983).
7 Gumbel Distribution Gumbel Distribution is a statistical method often used for predicting extreme hydrological events such as floods (Zelenhasic, 1970; Haan, 1977; Shaw, 1983). In this study it has been applied for Flood Frequency Analysis because (a) peak flow data are homogeneous and independent hence lack long-term trends; (b) the river is less regulated, hence is not significantly affected by reservoir operations, diversions or urbanization; and (c) flow data cover a relatively long record (more than 10 years) and is of good quality (Mujere, 2006). The equation for fitting the Gumbel Distribution to observed series of Flood flows at different return periods T is (Sarma, 1999): Qt= Qav + K (1). where Qt denotes the magnitude of the T-year Flood event, K is the Frequency factor, Qav and are the mean and the standard deviation of the maximum instantaneous flows respectively. The Frequency factor K is expressed as (Lehre, undated): K=- 6/ ( -ln(ln(T-ln(T-1))) (2).)
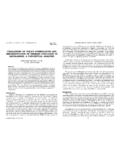
8 Where: = , is the Euler constant (= ) and ln is the natural logarithm. The Chi-square 2 test was carried out to find the goodness of fit between the measured and predicted Flood flows. It was applied to test the hypothesis that the Flood data fit the Gumbel Distribution . After determining the goodness of fit of the Distribution to the Flood discharges, Flood magnitudes were computed for , , , , , , and exceedance probabilities. Results The maximum instantaneous flow of 233 m3/s was recorded at E119 in 1985 while the lowest Flood flow of m3/s was recorded in 1998. The 30-year mean instantaneous Flood flow is m3/s with a coefficient of variability, CV of 85%. Measured and predicted Flood flows show no significant (p= ) differences hence, a goodness of fit of the Gumbel Distribution (Figure 2. ISSN : 0975-3397 Vol. 3 No. 7 July 2011 2776. Never Mujere / International Journal on Computer Science and Engineering (IJCSE). 250. 200. Flow (m3/s). 150. 100.)
9 50. 0. 69. 71. 73. 75. 77. 79. 82. 84. 86. 88. 90. 92. 94. 96. 98. 19. 19. 19. 19. 19. 19. 19. 19. 19. 19. 19. 19. 19. 19. 19. Years Measured Predicted Fig. 2. Measured and predicted Flood flows. Due to the good relationship shown on Figure 3, the Gumbel model was used to predict Flood flows for different return periods (Table 1). Table 1. Flood estimation Using the Gumbel Distribution . Return period Flood flow T (years) Q (m3/s). 2 5 10 20 25 50 100 200 Results have shown that Nyanyadzi River Flood flows were variable during the 30 years of studied. The 2 test revealed a satisfactorily fit between observed and estimated Flood flow values. Hence, Gumbel Distribution can be used to predict Frequency of floods. Conclusion Flood Frequency Analysis had been carried out for Nyanyadzi River Using 30 years of peak flow data. The outcome of the Analysis clearly reveals the good capability of the Gumbel Distribution function to predict river Flood magnitudes (Figure 2).
10 There were no significant differences (p = ) between the predicted and measured flow magnitudes. Hence, the model can be reliably applied to predict the occurrence of Nyanyadzi River floods. ISSN : 0975-3397 Vol. 3 No. 7 July 2011 2777. Never Mujere / International Journal on Computer Science and Engineering (IJCSE). Acknowledgments The author gratefully acknowledges the assistance and support of ZINWA staff for collecting, processing and giving river flow data used in this study. I would like to recognize the valuable comments and suggestions made by my friends. References [1] AGRITEX 2000. Assessment of the Impact of Cyclone Eline (February 2000) on the Food, Agriculture and Natural resource Sector in Zimbabwe. AGRITEX, Harare. [2] Haan, 1977. Statistical Methods in Hydrology. Iowa State University Press, Iowa. [3] Law, G. S. and Tasker, G. D. (2003) Flood - Frequency Prediction Methods forUnregulated Streams of Tennessee, 2000. Water Resources Investigations Report 03-4176, Nashville, Tennessee.