Transcription of Flow-Duration Curves - USGS
1 Flow-Duration CurvesManual of Hydrology: Part 2. Low-Flow TechniquesGEOLOGICAL SURVEY WATER-SUPPLY PAPER 1542-AFlow-Duration CurvesBy JAMES K. SEARCYM anual of Hydrology: Part 2. Low-Flow TechniquesGEOLOGICAL SURVEY WATER-SUPPLY PAPER 1542-AMethods and practices of the Geological SurveyUNITED STATES GOVERNMENT PRINTING OFFICE, WASHINGTON : 1959 UNITED STATES DEPARTMENT OF THE INTERIOR WALTER J. HICKEL, SecretaryGEOLOGICAL SURVEY William T. Pecora, DirectorFirst printing 1959 Second printing 1963 Third printing 1969 CONTENTSPageAbstract_____ 1 Preparation of 3 Period used_____ 3 Time units_____ 4 Class intervals--__---_--____----_-_____-_-___ __ 6 Compiling Flow-Duration data. _____ 7 Use of form 9-217c_____ 7 Use of form 9-217d_____ 9 Presentation of 9 Tabular presentation_____ 9 Graphical presentation_____ 10 Type of paper_____ 11 Discharge 11 Long-term Flow-Duration Curves from short-term 12 Selection of the index station_____-_____-_____-_____ 14 Establishing the relation___-_---__-___--_____-_____--___ -__ 14 Adjusting the short-term record_____ 16 Estimation of the Flow-Duration 17 Hydrologic significance of the Flow-Duration curve _____ 21 Shape of the curve_____ 22 Median _____ 22 Uses of the Flow-Duration curve__--------_-__-__---_-_-_____-_-_-_ _ 23 Studying the effect of geology on low flows.
2 _____ 24 Water-power studies_____ 26 Stream-pollution 29 Quality-of-water 29 Variability indexes_____-____-___--_-__-____-_------ _-_-__-__--___ 30 Lane's variability index. 30 Reliability of an individual station record_____ 32 References 33inIV CONTENTSILLUSTRATIONSFIGURE 1. Duration curve of daily flow, Bowie Creek near Hattiesburg,Miss., 22. Duration Curves of daily, monthly, and annual flows, BowieCreek near Hattiesburg, Miss., 53. Curve for changing class intervals on Flow-Duration dHa fromBowie Creek near Hattiesburg, Miss., 1939-48. _____ 64. Duration of daily discharge, Bowie Creek near Hattiesburg,Miss., for year ending Sept. 30, 1943, form 9-217c__-___-_. 85. Summary of duration of daily discharge, Bowie Cr?
3 Ek nearHattiesburg, Miss., 1939-48, form 9-217d_____ 106. Comparison of Flow-Duration Curves for three nearby stations in northeastern Georgia, water year 1952. A, In terms of dis- charge ; B, In terms of ratio to mean 137. Correlation between Kankakee River and Iroquoh River,based on discharge of equal percent duration_____ 168. Duration Curves of daily flow, Iroquois River near Chebanse, 189. Correlation between Kankakee River and Iroquoi^ River,based on 10 discharge measurements, 2010. Relation of duration and frequency 2311. Geologic map of area in southern Mississippi having approx- imately uniform climate and 2512. Flow-Duration Curves for selected Mississippi streams, 1939-48. 2713. Flow-Duration curve applied to hydropower study _____ 28 TABLESPage TABLE 1.
4 Class limits for discharges on Flow-Duration 72. Discharge of equal percent duration on two rivers in Illinois. __ 153. Days of concurrent discharge, Kankakee River and IroquoisRiver stations, 111., 19 MANUAL OF HYDROLOGY: PART 2, LOW-FLOW TECHNIQUESFLOW-DURATION CURVESBy JAMES K. SEARCTABSTRACTThe Flow-Duration curve is a cumulative frequency curve that show the percent of time specified discharges were equaled or exceeded during a given period. It combines in one curve the flow characteristics of a stream throughout the range of discharge, without regard to the sequence of occurence. If the period upon which the curve is based represents the long-term flow of a stream, the curve may be used to predict the distribution of future flows for v'ater- power, water-supply, and pollution report shows that differences in geology affect the low-flow ends of flow- duration Curves of streams in adjacent basins.
5 Thus, duration Curves aro use- ful in appraising the geologic characteristics of drainage method for adjusting Flow-Duration Curves of short periods to represent long-term conditions is presented. The adjustment is made by correlating the records of a short-term station with those of a long-term Curves have been in general use since about 1915; their theory has been discussed by Foster and others. (See Iht of references.) This chapter describes the methods used by the Geologi- cal Survey to construct Flow-Duration Curves from streamflow data and is a revision of instructions originally prepared by W. D. Mitehell and W. B. Langbein, for use in the Survey only, and later modified by C. H. Flow-Duration curve (fig. 1) is a cumulative frequency curve that shows the percent of time during which specified discharges were equaled or exceeded in a given period.
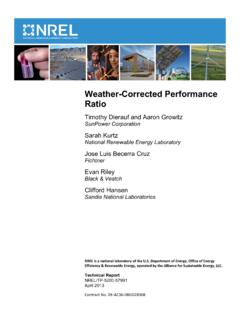
6 For example, in the period 1939-48, the daily mean flow of Bowie Creek (fig. 1) was at leas4; 144 cubic feet per second during 90 percent of the Flow-Duration curve is the integral of the frequency diagram. Perhaps a simpler concept of the Flow-Duration curve is that it is another means of representing streamflow data combining in one curve the flow characteristics of a stream throughout the ranges ofMANUAL OF HYDROLOGY: PART 2, LOW-FLOW TECFTC1 QUES10,000900080007000600050001000900800 700600500400\\YMirrmum 12 5 10 20304050607080 90 95 9899 OF TIME INDICATED DISCHARGE WAS EQUALED OR EXCEEDEDFIOURK 1. Duration curve of daily flow, Bowie Creek near Hattiesburg, Miss., Although the Flow-Duration curve does not show the chronological sequence of flows, it is useful for many prepare a Flow-Duration curve, the daily, weekly, or monthly flows during a given period are arranged according to magnitude, and the percent of time during which the flow equaled or exceeded the specified values is computed.
7 The curve, drawn to average the plotted points of specified discharges versus the percent of time dur- ing which they were equaled or exceeded, thus reprsents an average for the period considered rather than the distribution of flow within a single a strict sense, the Flow-Duration curve applies only to the period for which data were used to develop the curve or to the period to which the curve is adjusted. If streamflow during tH period on which the Flow-Duration curve is based represents the long-term flow of the stream, the curve may be considered a probability curve and used to estimate the percent of time that a specified discharge will be equaled or exceeded in the Flow-Duration curve provides a convenient means for studying the flow characteristics of streams and for comparing or , basin with another.
8 Various uses of the Flow-Duration curve are discussed Curves 3 PREPARATION OF DATAThe two principal methods used to construct Flow-Duration Curves are (1) the calendar-year method (Barrows, 1943, p. 137-143 and Saville and Watson, 1933, p. 408-411) and (2) the total-period the calendar-year method, the discharges for one year are ranked according to magnitude (order number 1, 2, 3 * * *). This process is repeated for each year of record. The discharges for each order number are averaged. A block diagram is plotted with the abscissa in time units and the ordinate in discharge units. If a day is the time unit, the first item plotted is the average of the annual maximum days for the period of record. A percent-of-time scale can be con- structed for the abscissa, if desired.
9 The calendar-year method gives lower values for the high discharges and higher values for th low discharges than the more accurate total-period the total-period method, all discharges are placed in classes ac- cording to their magnitude. The totals are cumulated, beginning with the highest class, and the percentage of the totaled time is com- puted for each class. The data are then plotted with the discharge as the ordinate and the time in percent of total period as the Geological Survey uses the total-period method and the dis- cussion which follows is restricted to this USEDAll complete years of record can be used to prepare a Flow-Duration curve; records for partial years should be excluded. The years for which records are complete need not be consecutive, but the records used should be for years in which physical conditions in the basin, such as artificial storage, diversions, or other manmade influences, were essentially the same.
10 The double-mass curve, which is discussed in another chapter of this manual, is useful for checking the consist- ency of records to be used for constructing Flow-Duration data for the Flow-Duration curve are usually prepared on a water-year basis, the same basis as that on which the Geological Sur- vey publishes streamflow records. The use of the water year (which ends September 30) in analyses of the Flow-Duration curve usually divides a low-flow period. This division is of no consequence for long records, but a Flow-Duration curve based on the water year of lowest an- nual flow might not represent a combination of flows as low as that which actually occurred in a 12-month period. When the flow-dura- tion curve is used to study the variations in streamflow from year to year, yearly Curves are prepared for climatic years beginning April some western streams, snowmelt during a few months provides practically all the flow available for use during the year.