Transcription of Fluorescence Spectroscopy and Water Quality - Horiba
1 Fluorescence Spectroscopy and Water Quality Introduction Water travels through the envi-ronment carrying dissolved organic mat-ter (DOM), made up of various chemical compounds, which have entered the wa-ter column from many sources. The amount of DOM in Water and its chemi-cal composition vary in space and time. Light s interaction with DOM is a func-tion of its chemical make-up; thus fluo-rescence Spectroscopy can provide in-formation about the amount and type of DOM in a Water sample. Because the chemical composition of DOM is deter-mined by its original source material and the processing occurring in the envi-ronments through which it travels, DOM characterization using Fluorescence Spectroscopy can help find the source of DOM, as well as the pathway the Water transporting it has The amount and type of DOM in local Water systems is important for ur-ban planning, ecological studies, and understanding effects of trace amounts of organic compounds on living organ-isms.
2 Fluorescence Spectroscopy , es-pecially the excitation-emission matrix (EEM), is becoming more popular for determining the amount of DOM con-tamination in Water . Using EEMs to de-termine polyaromatic hydrocarbon and humic substances (soil-derived com-pounds) seems especially effective. Brian Bergamaschi and co-workers at the Geological Survey have been 1 Cory, , and McKnight, , Environ. Sci. Technol., 39 (2005), 8142 8149, Fig. 1. FluoroMax spectrofluorometer. recording EEMs of Water sources in California to monitor Water Experimental method Water samples were quickly fil-tered in the field through m pre-combusted glass-fiber filters, chilled, and shipped overnight to the laboratory in Sacramento, California.
3 After the sample equilibrated to 25 C, it was placed in a 1-cm2 quartz cuvette inside the sample compartment. An EEM was constructed by measuring a sample s Fluorescence via a Fluoro-Max spectrofluorometer (Fig. 1) at thousands of combinations of excitation (200 400 nm) and emission (220 600 nm) wavelengths. An automatic shutter 2 Kraus, Tamara , et al., Org. Geochem., 39(9), 2008, pp. 1302 1318; Bergamaschi, , et al., Geological Survey Scientific Investigations Report 2005-5152, 38 pp. (2005). FFLL--2288 Copyright 2009 Horiba Scientific; version protected the samples from photo-bleaching.
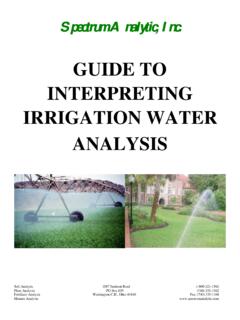
4 While recording fluores-cence, the signal was corrected with the reference detector. Results and discussion An example of a typical EEM from a Water sample originating in a natural tidal wetland is shown in Fig. 2. Fig. 2. EEM recorded from Water in a natural tidal wetland. Such EEMs can be decomposed into excitation-emission components, representative of fluorophores, via sta-tistical methods. Bergamaschi, et al. used parallel factor analysis (PARAFAC) to decompose data into separate components, and provide val-ues proportional to each component s signal.
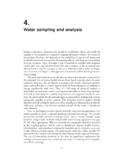
5 Fig. 3 is an example of PARAFAC decomposing an EEM. With separate components determined, plots of loading (proportional to signal) versus excitation and emission can be drawn (Fig. 4.). Conclusions Ecological and geological studies Fig. 3. PARAFAC analysis on the EEM in Thirteen separate modelled components de-scribe 98% of the variability. Fig. 4. Loading (y-axis) vs. wavelength (x-axis) for the components in Fig. 3. by means of parallel factor analysis of EEMs has been shown to be a useful application involving Horiba Jobin Yvon spectrofluorometers.
6