Transcription of Fourier Transform Infrared Spectroscopy - Weebly
1 Fourier Transform Infrared Spectroscopy : Low Density Polyethylene, High Density Polyethylene, Polypropylene and Polystyrene Eman Mousa Alhajji North Carolina State University Department of Materials Science and Engineering MSE 255 Lab Report 203. A. Patrick Snyder 3/13/2016. Abstract The objectives of this experiment are to analyze the vibrational properties and Fourier Transform Infrared Spectroscopy (FTIR) measurements of four polymers assigned to unknown spectra, examine how different bonds and functional groups give rise to different FTIR signatures and estimate % crystallinity in LDPE and HDPE as semi-crystalline polymers. FTIR spectrum of sample A was identified to relate to PP molecular structure with two functional groups: methyl and methylene. The FTIR spectrum of sample A was identified to relate to PS molecular structure with two functional groups, methylene and Phenyl.
2 The FTIR spectra of sample C and sample D. were identified to relate to PE molecular structure with a functional group of methylene. With difference in the areas under peaks, sample C was determined to be LDPE and sample D was determined to be HDPE. The percent crystallinities of LDPE and HDPE were estimated correctly to be % and respectively. The implication of this experiment is that different functional groups and percent crystallinity are two major factors making each IR spectrum of the four samples a unique one by which chemical structural analysis can be achieved. 1. Introduction Fourier Transform Infrared Spectroscopy (FTIR) is a method used to obtain an Infrared spectrum of absorption or emission of a solid, liquid or gas. An FTIR spectrometer simultaneously collects high spectral resolution data over a wide spectral range.
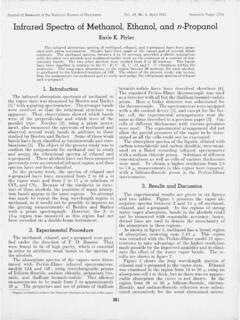
3 1 Figure 1 shows the typical arrangement of FTIR. The five main components of FTIR are radiation source, interferometer, sample, detector and mono IR beam. Figure 1. The typical arrangements of FTIR. 1. The radiation source used in FTIR is polychromatic Xe lamp. An interferometer consists minimally of two mirrors and a beam splitter. It works by first dividing the beam coming from the lamp, which gives rise an optical path difference, then recombining them at a beamsplitter after being reflected off stationary and moving mirrors. The detector measures interference signal as a function of optical path difference. The beams undergo constructive interference and can be considered in phase with a maximum detector response if the split beams have a difference of . The beams undergo destructive interference and 180o out of phase if the optical paths differ by /2.
4 2. The amplitude of the wave is reduced by an amount proportional to sample in beam. Finally, the detected intensity as a function of moving mirror position converted to the final IR spectrum, A or T vs (cm-1), by a Fourier Transform . 2. The principles of this technique rely on absorption or emission of the sample at a particular frequency in relation to its vibrational motion of molecules. Molecular vibration, the coupled motion of atoms within molecules, has the following modes: stretching, bending and rocking, each of which corresponds to an energy level. IR spectra contains peaks at frequencies where it represent transitions between quantized vibrational energy states, which corresponds to a particular functional group. Energy difference for transitions between the ground state and first excited state of most vibrational modes occurs in the mid-IR range, which is between 4000-400 wavenumber (cm-1).
5 IR spectra is used in both chemical and structural analyses. A substance can be chemically identified by matching observed IR spectrum with known database. Also, structures can be determined as functional groups give rise to characteristic bands. FTIR is faster, more reliable and more powerful comparing to a classic dispersive IR spectrometer. In FTIR spectrometer, more energy reaches the sample and a wavelength range of IR does not have to be continuous when scanned. The objective of this experiment is to analyze the vibrational properties of four polymers by measuring and observing the FTIR spectra Using Varian 640-IR, FT-IR Spectrometer. In addition, different bonds in relation to their functional groups giving rise to different FTIR. signatures are examined. Finally, % crystallinity in semi-crystalline polymers are calculated.
6 The specimens being examined are low density polyethylene, high density polyethylene, polypropylene and polystyrene. 3. Experimental Procedure The instrument used in this experiment was Varian 640-IR, FT-IR Spectrometer. The specimens being examined were low density polyethylene (LDPE), high density polyethylene(HDPE), polypropylene(PP) and polystyrene (PS). LDPE sample was taken from a milk container, HDPE sample was taken from 6 pack ring holder, PP sample was taken from CD. case and PS sample was taken from coil installation. The hardware components were a Duraglow mid-IR source, KBr beamsplitter, and a Peltier-cooled DLaTGS detector; a HeNe laser, which was used for calibrating distance of the moving mirror. The software used with the FTIR spectrometer was Resolutions Pro. The experiment was operated at room temperature and an absolute pressure of 1 atm.
7 The method used was attenuated total reflection (ATR) attachment. An ATR attachment operates by measuring the changes that occur in a totally internally reflected Infrared beam when the beam comes into contact with a sample. This internal reflectance creates an evanescent wave that extends beyond the surface of the crystal into the sample held in contact with the crystal. ATR. is beneficial in the way it increases the signal ratio by contacting the sample at multiple points. The crystal material used for ATR was Zinc Selenide (ZnSe), known for its high reflective index. ZnSe scratched easily and care was taken when cleaning the crystal. The crystal was cleaned by using a lens paper and alcohol. The parameters were as following: 32 scans arrange with each other, 8 sensitivity, 4000-600 range of waves, and a resolution of 4 cm-1.
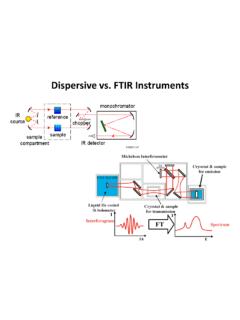
8 Cautions were taken into consideration. Hand gloves were used in order to avoid oil contamination from fingers. Dry air was used to avoid lens exposure to air which could change the microstructure of the lenses and IPA was used to clean ZnSe. 4. Each sample one at a time was mounted, and pressed down right on the crystal. Then the FTIR spectrometer was turned on and the measurement was collected. As with all FT-IR. measurements, an Infrared background was collected as shown in Figure 2, from the clean ATR. crystal to avoid positions of disturbing bands. FTIR Spectrum of the Background 1. 2000- 1280 cm-1. Absorbance disurbed by H2O. 0. 600 1100 1600 2100 2600 3100 3600. Wavenumber (cm-1). Figure 2. The FTIR spectrum of the background. The repeat units, as shown in Figure 3, for the polymers being examined were used in order to relate the FTIR signatures to the polymer structures.
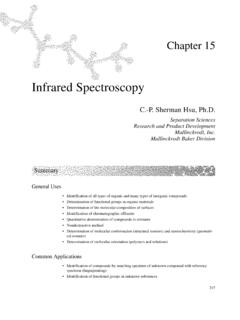
9 The % crystallinities of the LDPE and HDPE samples were calculated using (1- Equation 1) 100. (a) (b) (c). Figure 3. Repeat units for (a) polyethylene, (b) polypropylene, and (c) polystyrene. 1. 5. (1). where x is the amorphous content, the value is the intensity ratio of the two bands in a spectrum of a 100% crystalline PE sample, Ia is the intensity of crystallinity methylene rocking peak and Ib is the intensity of amorphous methylene rocking peak. Results The FTIR spectra were calculated and given without the samples' names. Sample A indicates 10. major peaks, as labeled in Figure 3. It represents two active functional groups: methylene and methyl. Table 1 shows the frequencies with its corresponding vibrational modes and functional groups. Sample A shows peak splitting. FTIR Spectrum Sample A. 8. 9. Absorbance 10.
10 7. 5. 6. 1 2 3. 0. 600 1100 1600 2100 2600 3100 3600. Wavenumber(cm-1). Figure 4: Sample A IR Spectrum. 6. Sample B indicates 12 major peaks, as labeled in Figure 3. It represents two active functional groups: groups: methylene and Table 2 shows the frequencies with its corresponding vibrational modes and functional groups. Sample B shows no or few peak splitting. Table 1: Peaks corresponding to vibrational moods and functional groups of sample A. Peak 1 2 3 4 5. Number Frequency 845 910 1155 1370 (cm-1). Vibrational Amorphous Rock Crystalline Rock Amorphous Crystalline C-H Bending mood & Methylene(C-H2) Methylene(C-H2) Bending Bending Methylene(C- Functional Methylene(C- Methylene(C- H2). Group H2) H2). Peak 6 7 8 9 10. Number Frequency (cm-1). Vibrational Amorphous C-H asym/sym C-H asym/sym C-H asym/sym asym/sym mood & Bending Stretching Stretching Stretching Stretching Functional C-H Bending Methylene(C-H2) Methyl (-CH3) Methyl (-CH3) Methyl (C-H).